. 2009 Apr 15;122(Pt 8):1091-9.
doi: 10.1242/jcs.039644. Epub 2009 Mar 19.

A Golgi-associated protein 4.1B variant is required for assimilation of proteins in the membrane

Affiliations

A Golgi-associated protein 4.1B variant is required for assimilation of proteins in the membrane

Qiaozhen Kang et al. J Cell Sci. .

Erratum in

Expression of concern in

Abstract

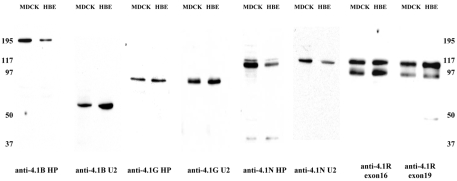
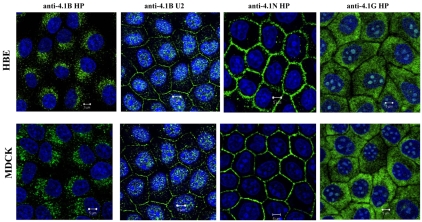
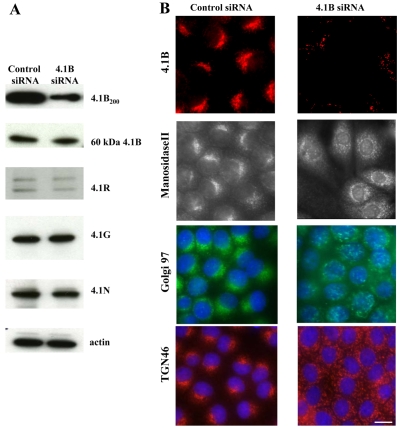
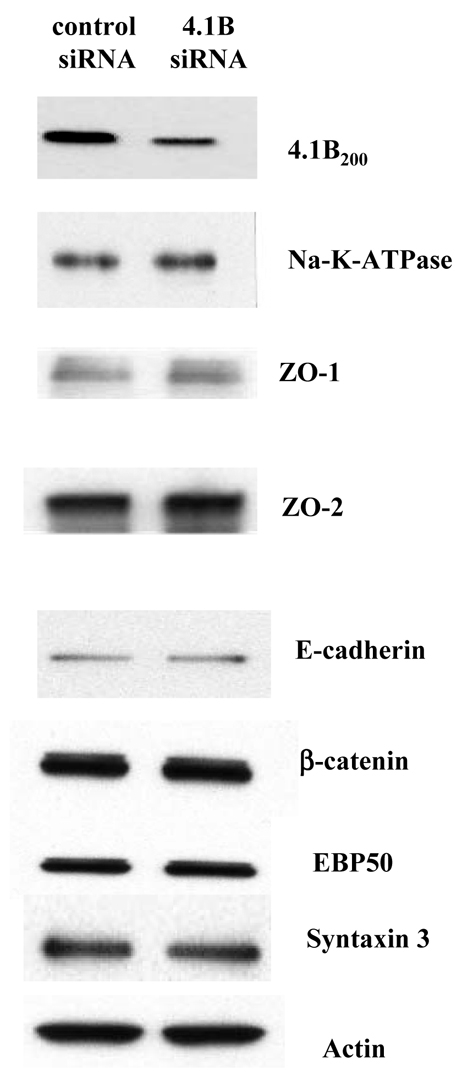
The archetypal membrane skeleton is that of the erythrocyte, consisting predominantly of spectrin, actin, ankyrin R and protein 4.1R. The presence in the Golgi of a membrane skeleton with a similar structure has been inferred, based on the identification of Golgi-associated spectrin and ankyrin. It has long been assumed that a Golgi-specific protein 4.1 must also exist, but it has not previously been found. We demonstrate here that a hitherto unknown form of protein 4.1, a 200 kDa 4.1B, is associated with the Golgi of Madin-Darby canine kidney (MDCK) and human bronchial epithelial (HBE) cells. This 4.1B variant behaves like a Golgi marker after treatment with Brefeldin A and during mitosis. Depletion of the protein in HBE cells by siRNA resulted in disruption of the Golgi structure and failure of Na(+)/K(+)-ATPase, ZO-1 and ZO-2 to migrate to the membrane. Thus, this newly identified Golgi-specific protein 4.1 appears to have an essential role in maintaining the structure of the Golgi and in assembly of a subset of membrane proteins.


Figures

Fig. 1.
Fig. 1.
Specificity of anti-4.1 antibodies. (A) Schematic representation of 4.1 domain structure. The boxes represent the structural domains of 4.1. The conserved domains are shown in empty boxes and the non-conserved unique domains (U1, U2 and U3) are shaded. Targeted regions are shown in dark gray. CTD, C-terminal domain; MBD, membrane-binding domain; SABD, spectrin-actin-binding domain. (B) Reaction of anti-4.1 antibodies with recombinant 4.1 proteins. Recombinant full-length 4.1 proteins (2 μg/lane) were subjected to immunoblot analysis with various anti-4.1 antibodies. Top panel, CBB staining of the proteins. No crossreaction of any antibody with other 4.1 proteins was seen. (C) Reaction of anti-4.1 antibodies with tissues. Cell lysates (20 μg of total protein) from wild-type and knockout mice were subjected to immunoblot analysis with various anti-4.1 antibodies. Note the absence of the relevant band in the corresponding knockout sample with the exception of anti-4.1B-U2 antibody.
Fig. 2.
Fig. 2.
Expression of 4.1 proteins in MDCK and HBE cells. Total cell lysate of MDCK and HBE cells was subjected to immunoblot analysis with the indicated polyclonal rabbit anti-4.1 antibodies. Note that the same proteins are expressed in both MDCK and HBE cells. Molecular size markers are shown in kDa on the left.
Fig. 3.
Fig. 3.
Localization of 4.1 proteins in MDCK and HBE cells. MDCK and HBE cells were stained with rabbit polyclonal anti-4.1B-HP, anti-4.1B-U2, anti-4.1N-HP and anti-4.1G-HP, followed by anti-rabbit Alexa Fluor 488-conjugated secondary antibody. Nuclei were stained with Tropo 3 (blue). The images were analyzed by confocal microscopy. Note the distinct localization of different epitopes. Scale bars: 5 μm.
Fig. 4.
Fig. 4.
Association of 4.1B200 with Golgi markers. (A) Colocalization of 4.1B200 with Golgi markers. HBE cells were co-stained with anti-4.1B-HP antibody (directly labeled with Alexa Fluor 594) and anti-βI-spectrin, anti-β-COPI, anti-Golgi97 or anti-TGN46 (directly labeled with Alexa Fluor 488). Merged images show that 4.1B200 colocalizes with all these Golgi proteins in the perinuclear region. Scale bar: 10 μm. (B) HBE cells were co-stained with anti-4.1B-HP antibody (directly labeled with Alexa Fluor 594) and anti-Rab5. Merged images show that 4.1B200 dose not colocalize Rab5. Scale bar: 10 μm. (C) Immunoprecipitation (IP) was performed using anti-4.1B-HP antibody. Proteins in the immunoprecipitate were detected with the antibodies as indicated. Note that βI spectrin was brought down with 4.1B200. Pre-immune IgG was used as negative control.
Fig. 5.
Fig. 5.
Dynamics of 4.1B200 protein. (A) Distribution of 4.1B200 in mitotic cells. Subconfluent HEB and MDCK cells were stained with anti-4.1B-HP (green) and Tropo 3 (red). Note that the staining of 4.1B200 is concentrated around perinuclear region in the interphase cells, but dispersed in all stages of mitotic cells. (B) Distribution of 4.1B200 in BFA-treated cells. Subconfluent HBE cells were either treated with 1% ethanol, 6 μg/ml BFA for 60 minutes at 37°C, or by washout after BFA treatment. The cells were fixed and stained as above. Note the perinuclear staining of 4.1B200 in control cells (left panel), dispersed staining in BFA-treated cells (middle panel) and the recovery of the perinuclear staining after BFA washout (right panel). Scale bars: 10 μm.
Fig. 6.
Fig. 6.
Depletion of 4.1B200 affects Golgi structure. (A) Specific knockdown of 4.1B200 in HBE cells. Total cell lysate from HBE cells transfected with control siRNA or 4.1B siRNA were subjected to immunoblot analysis using antibodies against 4.1B-HP, 4.1B-U2, 4.1R exon16, 4.1G-HP, 4.1N-HP and actin. Note the significant reduction of only 4.1B200. (B) Fragmentation of Golgi in 4.1B200-depleted HBE cells. HBE cells transfected with control siRNA or 4.1B siRNA were stained with anti-4.1B-HP or Golgi markers Golgi 97, TGN46 and mannosidase II. Note the perinuclear staining of all the marker proteins in control cells (left panels) but dispersed staining in 4.1B200-depleted cells (right panels). Scale bar: 10 μm.
Fig. 7.
Fig. 7.
Depletion of 4.1B200 results in impaired traffic of Na+/K+-ATPase, ZO-1 and ZO-2. (A) Mislocalization of Na+/K+-ATPase, ZO-1 and ZO-2 in 4.1B200-depleted HBE Cells. HBE cells were transfected with control siRNA (left panels), 4.1B siRNA (middle panels) or 4.1B siRNA co-transfected with mouse 4.1B (right panels). Transfected cells were stained with Golgi97, α-Na+/K+-ATPase, ZO-1 and ZO-2 antibodies. Note the diffuse distribution of these proteins in 4.1B200-depleted cells compared with their confinement to perinuclear region (for Golgi97) or the membrane (for α-Na+/K+-ATPase, ZO-1 and ZO-2) in control cells. Co-transfection of mouse 4.1B preserved Golgi structure and prevented the failed assembly of Na+/K+-ATPase, ZO-1 and ZO-2 in the 4.1B200-depleted cells. Z-sections are shown at top of each panel. Scale bars: 10 μm. Knockdown of human 4.1B200 and overexpression of mouse 4.1B was confirmed by western blot analysis (bottom panels). GAPDH was detected as loading control. (B) Altered glycosylation of β-Na+/K+-ATPase in 4.1B200-depleted HBE Cells. Total cell lysates from control or 4.1B-depleted cells were analyzed by western blotting using anti-β-Na+/K+-ATPase antibody. The broad band around 55 kDa (Gly) represents the mature glycosylated β-Na+/K+-ATPase and the sharp band around 40 kDa represents the ER-dependent core β-Na+/K+-ATPase glycosylation. Note a significantly increased core β-Na+/K+-ATPase glycosylation in 4.1B200-depleted cells. (C) Increased detergent-soluble fraction of α-Na+/K+-ATPase in 4.1B200-depleted HBE Cells. Detergent-soluble and detergent-insoluble fractions were analyzed by western blotting using anti-α-Na+/K+-ATPase antibody. Note that in control cells, most α-Na+/K+-ATPase is in the detergent-insoluble fraction, in marked contrast, in 4.1B-depleted cells, most is in the detergent-soluble fraction.
Fig. 8.
Fig. 8.
Depletion of 4.1B200 has no effect on the assembly of adherens junction proteins and apical proteins. HBE cells were transfected with control siRNA or 4.1B siRNA. Transfected cells were stained with E-cadherin, β-catenin, syntaxin 3 and EBP50. In both control (upper panels) and 4.1B200-depleted cells (lower panels), E-cadherin and β-catenin are located on the bilateral membrane, and syntaxin 3 and EBP50 on the apical membrane. Z-sections are shown at top of each panel. Scale bars: 10 μm.
Fig. 9.
Fig. 9.
Depletion of 4.1B200 has no effect on protein expression levels. Total cell lysate from HBE cells transfected with control siRNA or 4.1B siRNA was subjected to immunoblot analysis with the indicated antibodies. Note significant knockdown of 4.1B200 but not of other proteins.
Fig. 10.
Fig. 10.
Association of ZO-1 and ZO-2 with 4.1B200 in non-confluent but not confluent HBE cells. (A) Confluent HBE cells were co-stained with rabbit polyclonal anti-4.1B-HP antibody and mouse monoclonal anti-ZO-1 by indirect fluorescence. For co-staining of 4.1B and ZO-2, rabbit anti-4.1B-HP was directly labeled with Alexa Fluor 594 and rabbit anti-ZO-2 was directly labeled with Alexa Fluor 488. No colocalization was observed. Scale bars: 10 μm. (B) Subconfluent HBE cells were co-stained with anti-4.1B-HP and anti-ZO-1 or ZO-2 as described in A. Merged images show some colocalization of 4.1B200 with ZO-1 and ZO-2 in the perinuclear region and on the membrane. Scale bars: 10 μm. (C) Immunoprecipitation of confluent HBE cell lysates was performed using anti-4.1B-HP antibody. Proteins in the immunoprecipitate were detected with the antibodies as indicated. Note that ZO-1 and ZO-2 were not brought down with 4.1B200. (D) Immunoprecipitation of subconfluent HBE cell lysates and immunoblot were performed as described in C. Note that ZO-1 and ZO-2 were brought down with 4.1B200. Pre-immune IgG was used as negative control.

Similar articles

Cited by

References

    1. Aunis, D. and Bader, M. F. (1988). The cytoskeleton as a barrier to exocytosis in secretory cells. J. Exp. Biol. 139, 253-266. - PubMed
    1. Baines, A. J. and Bennett, V. (1985). Synapsin I is a spectrin-binding protein immunologically related to erythrocyte protein 4.1. Nature 315, 410-413. - PubMed
    1. Barr, F. A. and Short, B. (2003). Golgins in the structure and dynamics of the Golgi apparatus. Curr. Opin. Cell Biol. 15, 405-413. - PubMed
    1. Beck, K. A. (2005). Spectrins and the Golgi. Biochim. Biophys. Acta 1744, 374-382. - PubMed
    1. Beck, K. A., Buchanan, J. A., Malhotra, V. and Nelson, W. J. (1994). Golgi spectrin: identification of an erythroid beta-spectrin homolog associated with the Golgi complex. J. Cell Biol. 127, 707-723. - PMC - PubMed

Publication types

MeSH terms