

doi: 10.1126/science.1171641.
Epub 2009 Mar 19.
Circadian clock feedback cycle through NAMPT-mediated NAD+ biosynthesis
Affiliations
- PMID: 19299583
- PMCID: PMC2738420
- DOI: 10.1126/science.1171641
Item in Clipboard
Circadian clock feedback cycle through NAMPT-mediated NAD+ biosynthesis
Science.
.
Abstract
The circadian clock is encoded by a transcription-translation feedback loop that synchronizes behavior and metabolism with the light-dark cycle. Here we report that both the rate-limiting enzyme in mammalian nicotinamide adenine dinucleotide (NAD+) biosynthesis, nicotinamide phosphoribosyltransferase (NAMPT), and levels of NAD+ display circadian oscillations that are regulated by the core clock machinery in mice. Inhibition of NAMPT promotes oscillation of the clock gene Per2 by releasing CLOCK:BMAL1 from suppression by SIRT1. In turn, the circadian transcription factor CLOCK binds to and up-regulates Nampt, thus completing a feedback loop involving NAMPT/NAD+ and SIRT1/CLOCK:BMAL1.
Figures
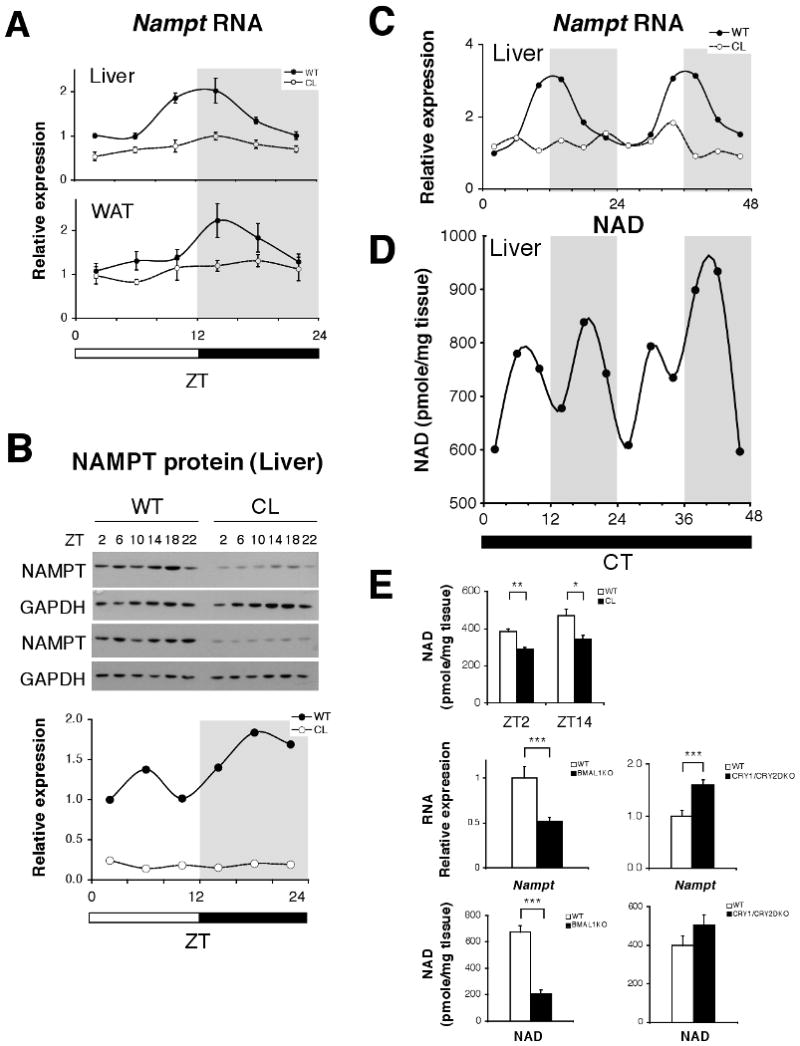
Oscillation of NAMPT-mediated NAD+ biosynthesis. (A) Relative expression levels of Nampt RNA in liver and white adipose tissue (WAT) across the 24 hr light:dark cycle. Gray shading indicates dark period (n=4-6 mice/genotype/time point). (B) Western blots showing NAMPT and GAPDH at indicated ZTs. Quantitation of NAMPT normalized to GAPDH. (C) Relative expression levels of Nampt RNA across 48 hrs in liver of WT and ClockΔ19 mice in constant darkness. Shading indicates where light and dark periods would normally occur under 12:12 LD conditions. (n=2 WT, n=1 ClockΔ19/time point); (p<0.01, one-way ANOVA for WT oscillation). (D) NAD+ levels across 48 hrs in liver of WT mice in constant darkness. (n=2 WT/time point). (E) NAD+ levels in WT and ClockΔ19 mutant liver at ZT2 and 14 (n=3) (upper panel). Relative expression levels of Nampt RNA (middle panels) and NAD+ (lower panels) in Bmal1-/-, Cry1-/-/Cry2-/-, and WT liver at ZT7 (n=4-13). *p<0.05; **p<0.01; ***p<0.001. All data is presented as mean ± SEM.
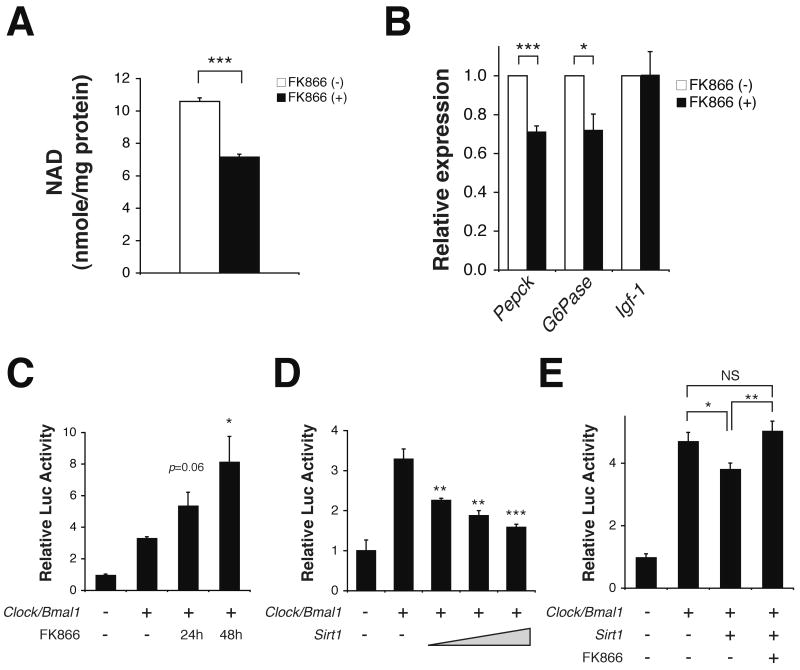
NAMPT, NAD+, and SIRT1 regulate CLOCK:BMAL1 activity. (A-B) NAD+ levels (A) and relative expression levels of Pepck, G6Pase, and Igf-1 RNA (B) in primary hepatocytes incubated with 200nM FK866 for 24 hours (n=3/group). (Pepck, phosphoenolpyruvate carboxykinase; G6Pase, glucose-6-phosphatase; Igf-1, insulin-like growth factor-1). (C-E) Relative luciferase activity of Per2-luciferase in the presence of: (C) 10nM FK866 for 24 or 48 hours, (D) increasing doses of Sirt1 (200, 400, 800 ng), and (E) Sirt1 (800 ng) alone or Sirt1 (800 ng) and 10nM FK866 for 48 hours. *p<0.05; **p<0.01; ***p<0.001; NS not significant. All data is presented as mean ± SEM.
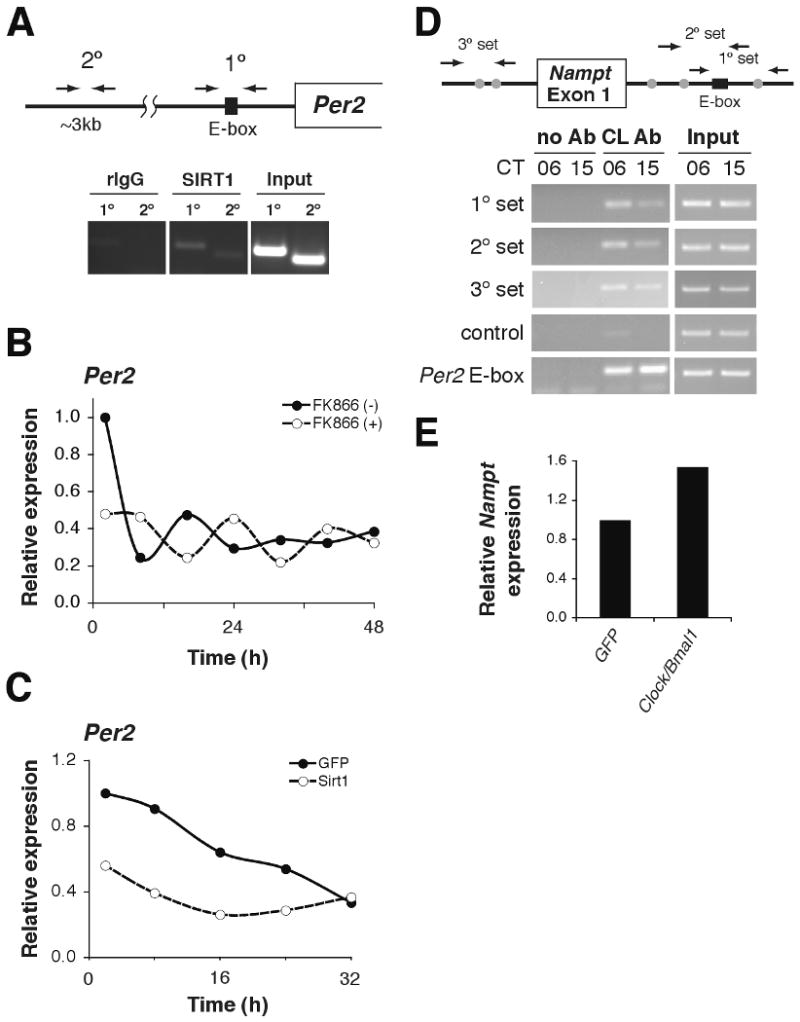
NAMPT/NAD+-driven feedback loop through SIRT1/CLOCK:BMAL1. (A) ChIP assays in primary hepatocytes for Per2 with rIgG control (left), SIRT1 antibody (middle), and input (right). Primer locations are schematically shown above. (B-C) Relative expression levels of Per2 RNA in primary hepatocytes following serum shock. Hepatocytes were either (B) incubated with 200nM FK866 or (C) infected with SIRT1- and GFP (control)-expressing adenovirus (average of 2 independent experiments). (D) ChIP assays in liver isolated from mice at CT6 and CT15 for Nampt with no Ab control (left), CLOCK antibody (middle), and input (right). Primer locations are shown schematically above. The black box indicates a canonical E-box, while gray circles represent non-canonical E-boxes. Control primers are located ∼5kb upstream of the Nampt transcriptional start site. Per2 E-box primers are included as a positive control. (E) Relative Nampt expression levels in adenovirally GFP- and Clock/Bmal1-infected mouse embryonic fibroblasts (average of 2 independent experiments).
Comment in
-
Circadian rhythms. A circadian loop asSIRTs itself.Science. 2009 May 1;324(5927):598-9. doi: 10.1126/science.1174132. Science. 2009. PMID: 19407188 No abstract available.
References
Publication types
MeSH terms
Substances
Grants and funding
LinkOut - more resources
Full Text Sources
Other Literature Sources
Medical
Molecular Biology Databases
Miscellaneous
