. 2009 Mar 27;87(6):825-30.
doi: 10.1097/TP.0b013e318199c7d2.

MRI assessment of ischemic liver after intraportal islet transplantation

Affiliations

MRI assessment of ischemic liver after intraportal islet transplantation

Naoaki Sakata et al. Transplantation. .

Abstract

Background: There is a recent focus on embolization of the portal vein by transplanted islets as a major cause of early graft loss. The resultant ischemia causes necrosis or apoptosis of cells within the liver. Thus, noninvasive assessment of the liver receiving the islet transplant is important to evaluate the status islet grafts.

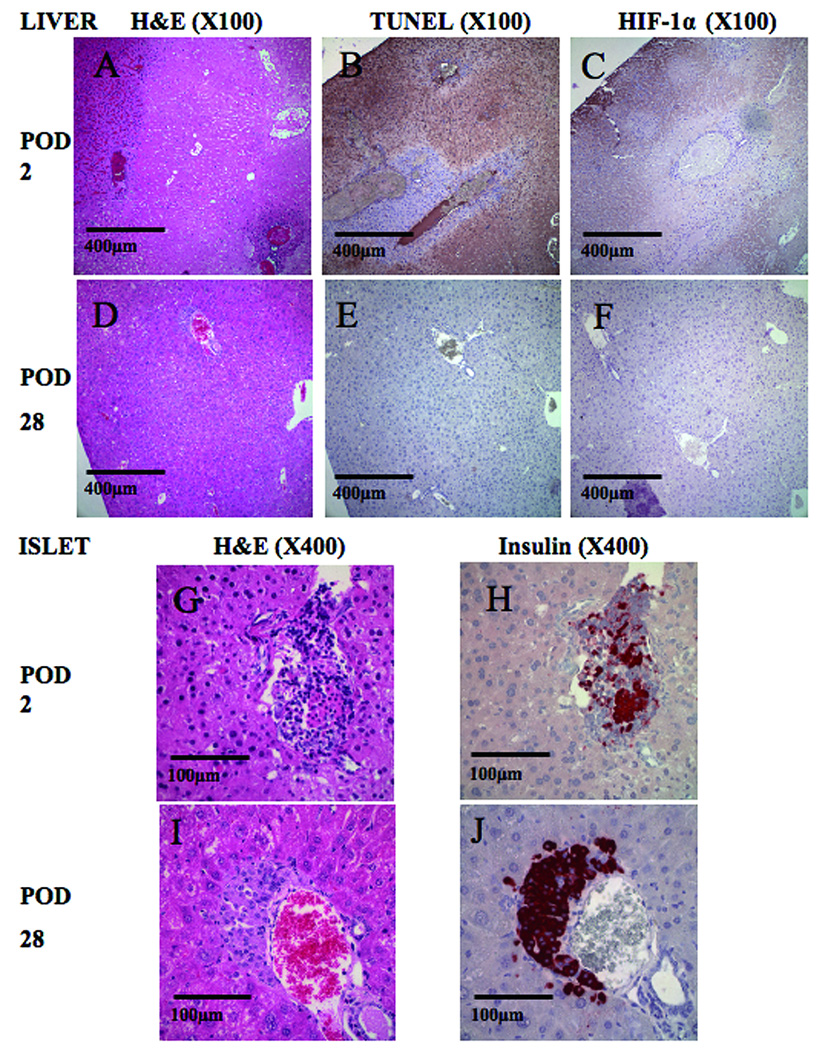
Methods: This study used noninvasive magnetic resonance imaging (MRI) for assessment of the posttransplant ischemic liver. Syngeneic islets in streprozotocin-induced diabetic mice were used. MRI and morphological liver assessments were performed at 0, 2, and 28 days after transplantation. Histologic assessment of insulin, hypoxia induced factor 1-alpha, and apoptosis were undertaken at similar time points.

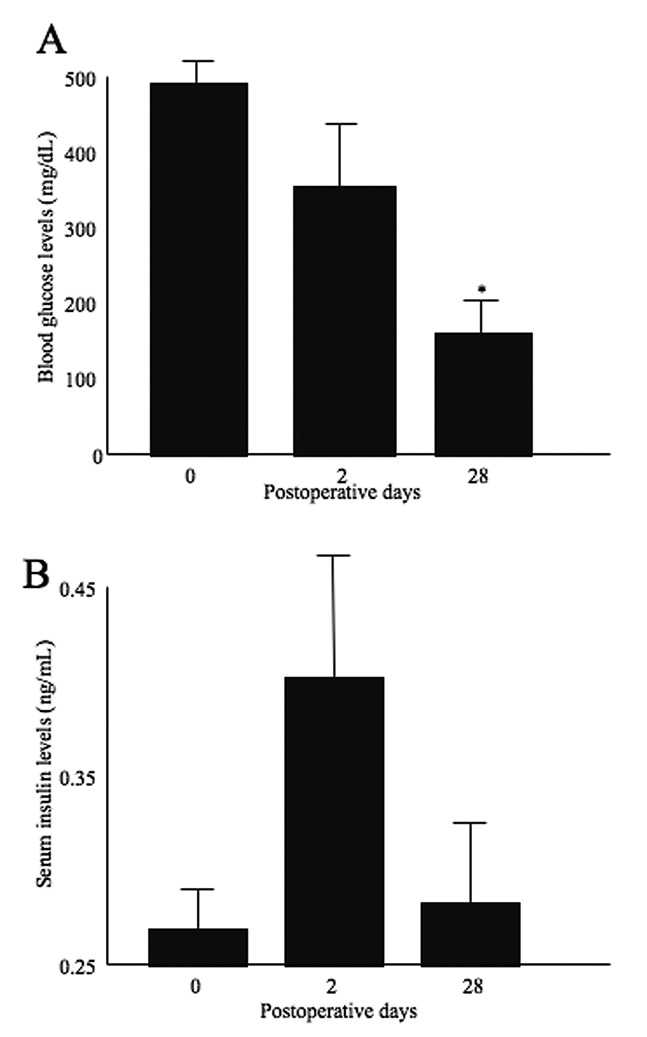
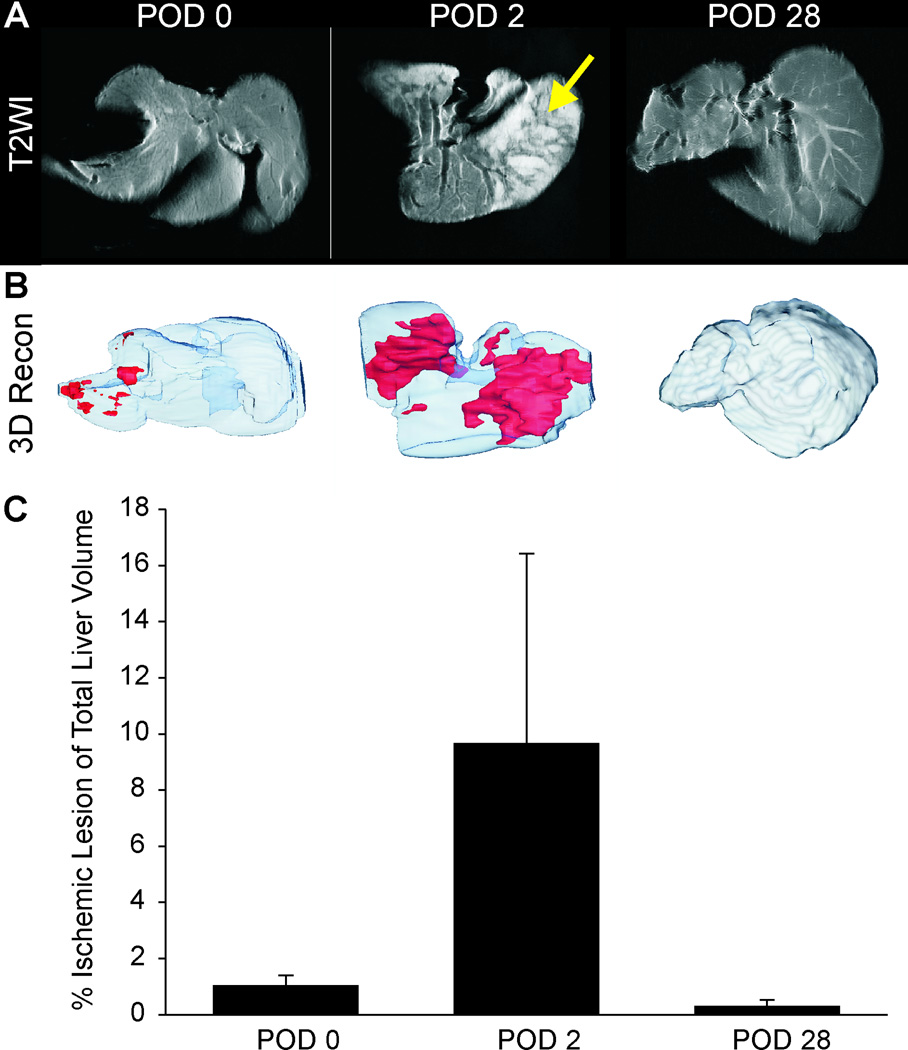
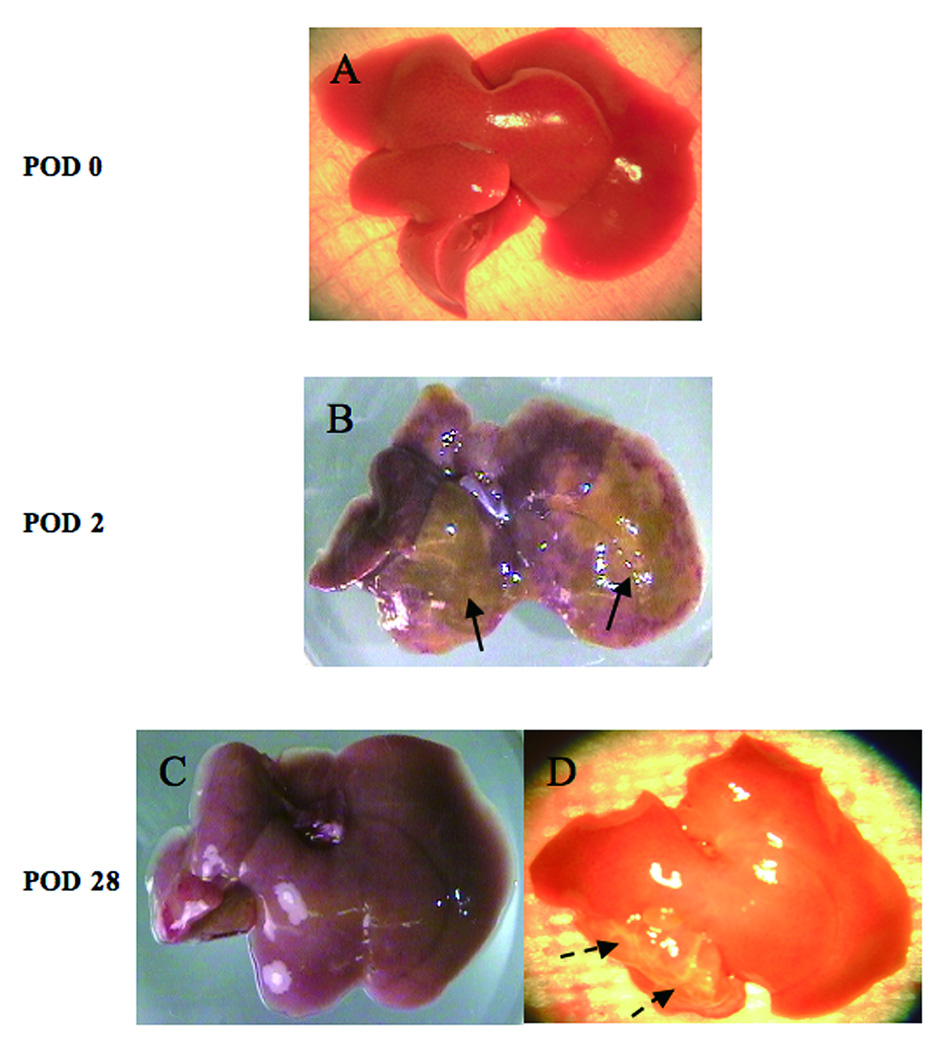
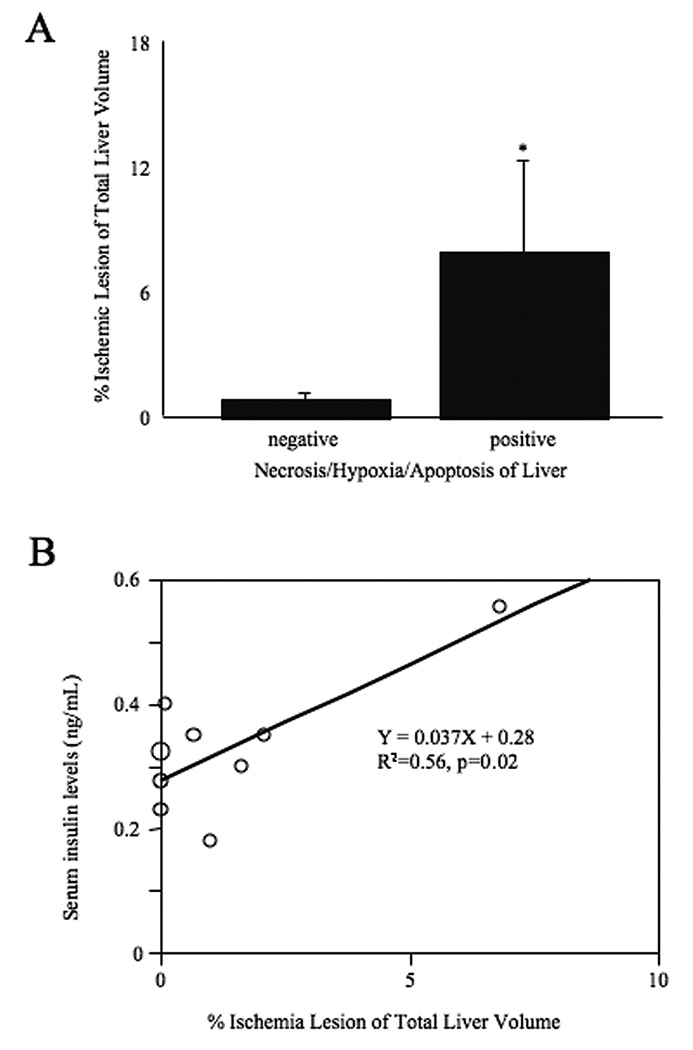
Results: Ischemic/necrotic regions in the liver were detected by MRI at 2 days but not at 28 days after transplantation and were confirmed histologically. Liver injury was quantified from high intensity areas on T2-weighted images. Insulin release peaked 2 days after transplantation.

Conclusion: Onset and reversal of liver ischemia due to intraportal islet transplantation are detectable using T2-weighted MRI. These changes coincide with periods of maximum insulin release likely due to partial islet destruction. We propose that MRI, as a noninvasive monitor of graft-related ischemia, may be useful in assessment of liver and islet engraftment after intraportal islet transplantation in a clinical setting.


Figures

Figure 1
Figure 1
Blood glucose levels (A) and serum insulin levels (B). Blood glucose was decreased and normalized at POD 28. Serum insulin levels were elevated at POD 2 and then decreased at POD28. Statistical assessment was performed by Dunnet test. Significant difference was p<0.05 (indicated as *).
Figure 2
Figure 2
T2-weighted MRI revealed a uniform contrast level within livers at POD 0 (A). At POD 2, regions of hyperintensity (arrow) were seen at the same location as necrotic areas of the liver. These findings are consistent with necrotic changes. At POD 28 there were no visible regions of hyperintensity on T2WI. (B) 3D volumetric assessment of ischemic liver reveals the percentage of hyperintensities within the liver that increased from a maximum at POD 2 but then decreased to control levels by POD 28. (C) Quantification of ischemic lesion volume showed a large increase at POD 2 that returned to control levels at POD 28.
Figure 3
Figure 3
Photomicrographs of fresh livers. There were no prominent visible ischemic area(s) in the liver at transplantation (POD 0)(A). Some ischemic / necrotic areas can be seen in the liver (arrows) at POD 2. (B). Ischemic changes, detected at the POD 2 of transplantation, were almost invisible (C) or turned to scars (dotted arrows, D) at POD 28.
Figure 4
Figure 4
Histological findings after islet transplantation (A–C, G and H). There were some necrotic areas at POD 2 (A: H&E staining). Apoptosis (B: TUNEL staining) and ischemic changes (C: immunostaining for HIF-1α) was also detected at the same lesion location as necrosis. In high magnification (X400), we detected cellular infiltration into transplanted islets (G: H&E staining and H: immunostaining for insulin). Histological findings at POD 28 (D–F, I and J). There was no necrotic (D: H&E staining), apoptotic (E: TUNEL staining) nor ischemic change (F: immunostaining for HIF-1α). Transplanted islets were intact (I: H&E staining and J: immunostaining for insulin). Original magnifications were X100 (A–F) and X400 (G–J).
Figure 5
Figure 5
A. Comparison ischemic lesion of liver ischemic volume (indicated as hyperintensity area in T2WI) with and without histological findings (necrosis / ischemia / apoptosis). The group with positive histological findings at POD 2 was significantly higher than negative group at POD 0 and POD 28). Statistical assessment was performed by Student t test. Significance indicated as *, p<0.05. B. Correlation between ischemic lesion and serum insulin levels. Data revealed that serum insulin levels significantly correlated with ischemic lesion (R2 = 0.56, p = 0.02). Statistical analysis was performed by simple regression analysis.

References

    1. Shapiro AM, Lakey JR, Ryan EA. Islet transplantation in seven patients with type 1 diabetes mellitus using a glucocorticoid-free immunosuppressive regimen. N Engl J Med. 2000;343:230. - PubMed
    1. Newsletter No.9. Giessen: Internationa Islet Transplnat Registry; 2001.
    1. Ryan EA, Paty BW, Senior PA. Five-year follow-up after clinical islet transplantation. Diabetes. 2005;54:2060. - PubMed
    1. Shapiro AM, Nanji SA, Lakey JR. Clinical islet transplant: current and future directions towards tolerance. Immunol Rev. 2003;196:219. - PubMed
    1. Yin D, Ding JW, Shen J, Ma L, Hara M, Chong AS. Liver ischemia contributes to early islet failure following intraportal transplantation: benefits of liver ischemic-preconditioning. Am J Transplant. 2006;6:60. - PubMed

Publication types

MeSH terms