. 2009 Apr 22;28(8):1043-54.
doi: 10.1038/emboj.2009.45. Epub 2009 Mar 19.

Acid sphingomyelinase activity triggers microparticle release from glial cells

Affiliations

Acid sphingomyelinase activity triggers microparticle release from glial cells

Fabio Bianco et al. EMBO J. .

Erratum in

  • EMBO J. 2009 May 6;28(9):1374

Abstract

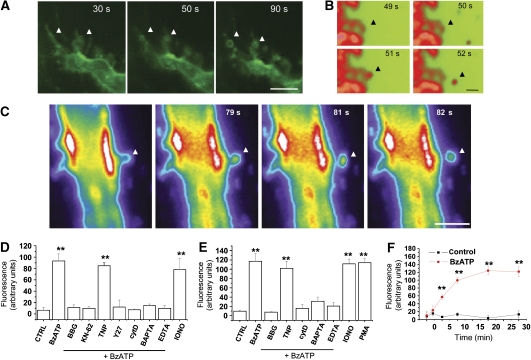
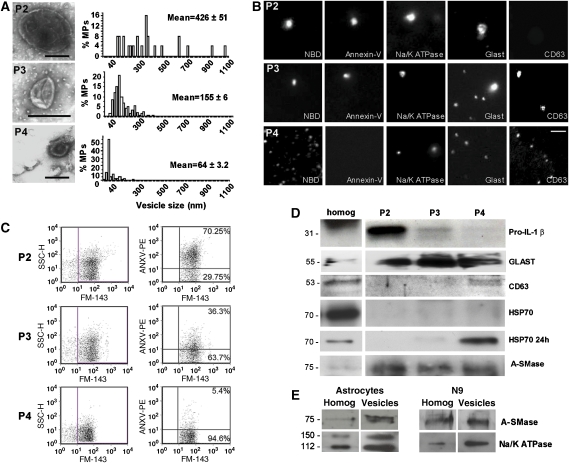
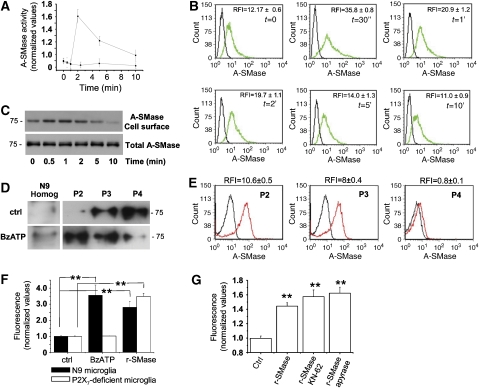
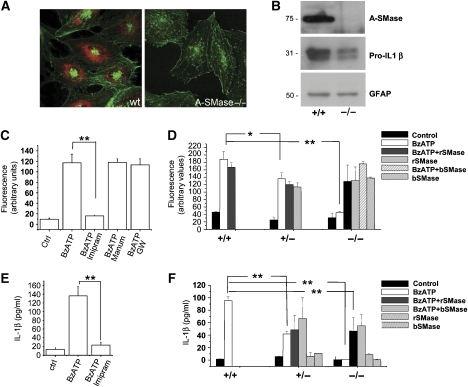
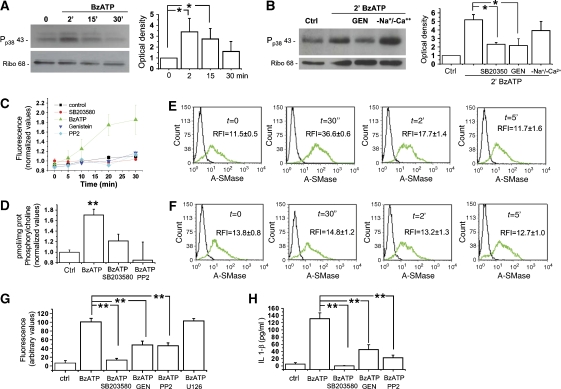
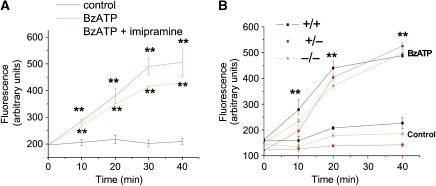
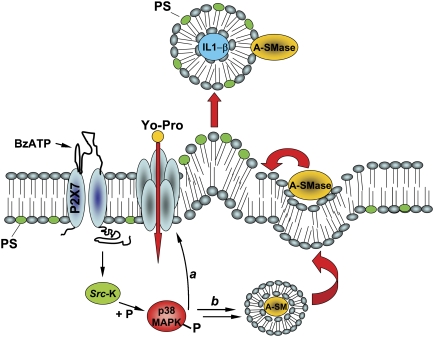
We have earlier shown that microglia, the immune cells of the CNS, release microparticles from cell plasma membrane after ATP stimulation. These vesicles contain and release IL-1beta, a crucial cytokine in CNS inflammatory events. In this study, we show that microparticles are also released by astrocytes and we get insights into the mechanism of their shedding. We show that, on activation of the ATP receptor P2X7, microparticle shedding is associated with rapid activation of acid sphingomyelinase, which moves to plasma membrane outer leaflet. ATP-induced shedding and IL-1beta release are markedly reduced by the inhibition of acid sphingomyelinase, and completely blocked in glial cultures from acid sphingomyelinase knockout mice. We also show that p38 MAPK cascade is relevant for the whole process, as specific kinase inhibitors strongly reduce acid sphingomyelinase activation, microparticle shedding and IL-1beta release. Our results represent the first demonstration that activation of acid sphingomyelinase is necessary and sufficient for microparticle release from glial cells and define key molecular effectors of microparticle formation and IL-1beta release, thus, opening new strategies for the treatment of neuroinflammatory diseases.


Figures

Figure 1
Figure 1
P2X7-dependent MP shedding from glial cells. (AC) Fluorescence images of FM1-43-labelled microglial N9 cells during 100 μM BzATP exposure (A, bar, 5 μm). Frames were taken at the indicated times after BzATP addition. BzATP treatment induces the formation of FM1-43-labelled vesicles along microglia philopodia (arrows). Fluorescence images of cortical astrocytes labelled with FM1-43 (B, bar, 1 μm) or NBD-labelled glioma cells (C, bar, 5 μm), showing the MP shedding from PM on BzATP exposure (see also Supplementary Movie). (D, E) The histograms show the spectrophotometric analysis of large fluorescent MPs pelletted at 10 000 g from supernatants of primary astrocytes (D) or N9 microglial cells (E) pre-labelled with FM1–43 and exposed to 100 μM BzATP for 20 min at 37°C. A significant reduction is observed in the amount of MPs released by cells exposed to BzATP after treatment with P2X7R antagonists (BBG, KN-62, TNP), the Rho-effector kinase inhibitor Y-27632 (Y27), the actin polymerisation inhibitor cytochalasin D (cytD) or the Ca2+ chelators BAPTA and EDTA. Besides BzATP, ionomycin (IONO) and PMA were also able to stimulate MP release (n=4, P<0.01, ANOVA analysis, Dunnet's method). (F) Spectrophotometric analysis of MPs pelleted at 10 000 g from supernatants collected from FM1-43-labelled cortical astrocytes at different time points after BzATP stimulation, showing the kinetic of vesicle accumulation into the extracellular medium.
Figure 2
Figure 2
Morphological and biochemical characterisation of MPs released by cortical astrocytes. (A) Negative staining electron microscopy of P2 (bar, 300 nm), P3 (bar, 300 nm) and P4 (100 nm) vesicles pelleted from supernatant of astrocyte exposed to 100 μM BzATP for 20 min was carried out as described in Supplementary Figure 2. Number of analysed vesicles from three different preparations: n=50, P2; n=161, P3; n=184, P4. (B) Fluorescence images of P2, P3 and P4 vesicles stained by NBD, annexin V, the exosome marker CD63 and Na+/K+ ATPase or GLAST, as PM markers. Bar, 5 μm. (C) FACS of astrocyte-derived P2, P3 and P4 vesicles labelled by annexin V-PE and NBD. (D) Western blotting of P2, P3 and P4 lysates obtained from medium conditioned for 30 min by 100 μM BzATP-treated astrocytes for IL-1β, A-SMase, membrane (GLAST) and exosome (CD63, HSP70) markers. Vesicle were loaded as described in Supplementary data. HSP70 staining is below ECL detectability in P4 vesicles 30 min after BzATP stimulation, but become clearly detectable in P4 vesicles on longer conditioning (24 h). For IL-1β blotting, vesicle fractions were obtained from supernatant of astrocytes exposed to BzATP for 15 min. (E) Immunoblot analysis of A-SMase and Na+/K+ ATPase in glial lysates and PM-derived MPs isolated by annexin V-coated beads (Supplementary data).
Figure 3
Figure 3
A-SMase is activated downstream of P2X7R stimulation. (A) Time course of A-SMase activation by 100 μM BzATP versus not stimulated cells as control, determined in cell lysates by measuring hydrolysis of sphingomyelin to phosphorylcholine at pH 5.5. Values are expressed as fold increases over basal A-SMase activity (1.12±0.3 nmol/mg h−1) conventionally indicated as 1 (n=3). (B) A-SMase translocation onto the PM on P2X7R stimulation as determined by FACS analysis of intact N9 microglial cells. The relative fluorescence intensity (RFI) was calculated as ratio of sample mean fluorescence over negative control mean fluorescence. The RFI values reported in the panels are the mean±s.e.m. measured in the three experiments. The results shown are from one out of three experiments. (C) Surface exposure of A-SMase on P2X7R stimulation, as detected by western blotting of biotinylated PM proteins with the A-SMase antibody. (D) Western blot analysis for A-SMase of P2, P3 and P4 vesicles accumulated in the supernatant of microglia cells under basal conditions or on stimulation with 100 μM BzATP for 30 min. (E) FACS analysis of intact P2, P3 and P4 vesicles for surface A-SMase, showing most of association of the enzyme to the outer leaflet of P2 and P3 MPs. (F) Spectrophotometric analysis of fluorescent MPs present in total supernatants collected from either FM1-43-labelled N9 microglial cells (black bars) or FM1-43-labelled N9 microglial clone, not expressing the P2X7R (white bars), 20 min after A-SMase (2 U/ml) or BzATP (100 μM) addition. (G) Quantitative analysis of FM1-43-labelled vesicles in the total supernatants of microglial cells exposed to exogenous A-SMase in the presence/absence of the P2X7R antagonist KN-62 or the ATP degrading enzyme apyrase.
Figure 4
Figure 4
Endogenous A-SMase mediates P2X7-induced vesicle shedding and IL-1β release. (A) Confocal images of cultured astrocytes from wt and A-SMase KO mice, stained for A-SMase (red) and falloidin (green) to show the specificity of A-SMase Ab. (B) Western blotting for A-SMase, IL-1β and GFAP carried out on wild type and A-SMase KO astrocyte lysates primed with LPS. (C) Quantitative analysis of 10 000 g pelleted MPs from FM1-43-labelled astrocytes pre-treated or not with the A-SMase inhibitor imipramine or the neutral SMase (N-SMase) inhibitors manumycin or GW4869, and then exposed to 100 μM BzATP for 20 min (n of experimental sessions=2, P<0.01, ANOVA analysis, Scheffe's method). (D) Spectrophotometric analysis of MPs present in the total supernatants collected from FM1-43-labelled astrocytes from A-SMase-wild type (+/+), heterozygous (+/−) or KO (−/−) mice. Astrocytes were exposed to 100 μM BzATP, recombinant (r-SMase) or bacterial (b-SMase) SMase, or a combination of BzATP and r-SMases/b-SMases (n of experimental sessions=2; P<0.01, ANOVA analysis, Tukey's method). (E) ELISA evaluation of IL-1β levels in the supernatant of LPS-primed astrocytes exposed to 100 μM BzATP for 30 min, in the presence/absence of A-SMase inhibitors. Thirty minutes after BzATP addition, IL-1β is clearly detectable in vesicle-free supernatant fraction. n=3; P<0.01, ANOVA analysis, Tukey's method. (F) ELISA for IL-1β on supernatant collected from BzATP-stimulated cortical astrocytes from A-SMase wild type (+/+), heterozygous (+/−) or KO (−/−) animals. BzATP-induced IL-1β release is completely blocked in KO cultures and partially rescued by addition of either r-SMase or b-SMase (n of experimental sessions=2, P<0.01, ANOVA analysis, Tukey's method). Both r-SMase and b-SMase failed to induce IL-1β release in the absence of BzATP stimulation, confirming requirement of P2X7R activation for the cytokine processing and release (Sanz and Di Virgilio, 2000).
Figure 5
Figure 5
Src kinase-dependent phosphorylation of p38 MAPK mediates P2X7-induced A-SMase activity. (A) Time course of p38 MAPK phosphorylation in astrocytes exposed to 100 μM BzATP for 2, 15 and 30 min. Right panel shows the quantitative analysis of P-p38 immunoreactivity normalised to ribophorin from three independent experiments. (B) Western blot analysis of cortical astrocytes exposed for 2 min to 100 μM BzATP in the presence/absence of the p38 MAPK inhibitor SB-203580 (400 nM) or the kinase inhibitor genistein (10 μM). Astrocytes were also exposed to BzATP in the absence of extracellular Na+ and Ca2+ and high extracellular K+ ions to inhibit ions influx. Right panel shows the quantitative analysis of P-p38 immunoreactivity normalised to the astrocyte marker ribophorin. (C) Time course analysis of Yo-PRO-1 uptake in astrocytes exposed to 100 μM BzATP in the absence or in the presence of the inhibitors of p38 MAPK phosphorylation pathway. Yo-PRO-1 uptake is sensitive to the inhibition p38 MAPK phosphorylation (n=3; P<0.01, ANOVA analysis, Dunnett's method). (D) A-SMase activity triggered by 100 μM BzATP treatment in the presence/absence of the p38 MAPK inhibitor SB-203580 (400 nM) or the src-kinase inhibitor PP2 (10 μM) (n=3; asterisks: P<0.01 versus control) normalised as described in Figure 3. (E, F) A-SMase exposure onto the PM induced by 100 μM BzATP treatment in the presence (E)/absence (F) of the p38 MAPK inhibitor SB-203580 (400 nM) measured by FACS in intact N9 microglial cells. The relative fluorescence intensity (RFI) was calculated versus negative controls. The results shown are from one experiment representative of three reproducible ones. The RFI values are determined as described in Figure 3. (G) Quantitative analysis of MPs pelleted at 10 000 g from the supernatants of FM1-43-labelled astrocytes exposed to 100 μM BzATP in the presence/absence of inhibitors of p38 MAPK phosphorylation pathway. FM1-43-labelled MPs pelleted at 10 000 g from the supernatants of astrocytes exposed to BzATP in the presence/absence of inhibitors of p38 MAPK phosphorylation pathway. (H) ELISA for IL-1β on supernatant conditioned for 30 min by 100 μM BzATP-stimulated astrocytes in the presence/absence of inhibitors of p38 MAPK phosphorylation pathway.
Figure 6
Figure 6
A-SMase activity does not control pore opening. (A) Time course analysis of Yo-PRO-1 uptake in astrocytes exposed to 100 μM BzATP in the presence/absence of A-SMase inhibitors. (B) Time course analysis of Yo-PRO-1 uptake in astrocytes from A-SMase wild type (+/+), heterozygous (+/−) or KO (−/−) animals on 100 μM BzATP exposure. (n=2; **P<0.01 versus controls, ANOVA analysis, Dunnett's method).
Figure 7
Figure 7
Model for P2X7R-induced signalling pathway involved in MP shedding and large pore opening in glial cells. On BzATP stimulation, P2X7R activates p38 MAPK cascade through src kinase-mediated phosphorylation. In turn, P-p38 triggers different pathways, among which PM pore formation (a), and mobilisation of A-SMase from luminal lysosomal compartment to PM outer leaflet (b) where the enzyme alters membrane structure/fluidity leading to PM blebbing and shedding. Differently from exosomes, shed MPs carry IL-1β cytokine, present A-SMase and high levels of PS on their membrane outer leaflet and are 100–1000 nm in size.

References

    1. Andrei C, Dazzi C, Lotti L, Torrisi MR, Chimini G, Rubartelli A (1999) The secretory route of the leaderless protein interleukin 1beta involves exocytosis of endolysosome-related vesicles. Mol Biol Cell 10: 1463–1475 - PMC - PubMed
    1. Bianco F, Pravettoni E, Colombo A, Schenk U, Moller T, Matteoli M, Verderio C (2005) Astrocyte-derived ATP induces vesicle shedding and IL-1 beta release from microglia. J Immunol 174: 7268–7277 - PubMed
    1. Brough D, Le Feuvre RA, Wheeler RD, Solovyova N, Hilfiker S, Rothwell NJ, Verkhratsky A (2003) Ca2+ stores and Ca2+ entry differentially contribute to the release of IL-1 beta and IL-1 alpha from murine macrophages. J Immunol 170: 3029–3036 - PubMed
    1. Brough D, Rothwell NJ (2007) Caspase-1-dependent processing of pro-interleukin-1beta is cytosolic and precedes cell death. J Cell Sci 120: 772–781 - PubMed
    1. Calegari F, Coco S, Taverna E, Bassetti M, Verderio C, Corradi N, Matteoli M, Rosa P (1999) A regulated secretory pathway in cultured hippocampal astrocytes. J Biol Chem 274: 22539–22547 - PubMed

Publication types

MeSH terms

LinkOut - more resources