. 2009 Mar;5(3):e1000426.
doi: 10.1371/journal.pgen.1000426. Epub 2009 Mar 20.

Independent S-locus mutations caused self-fertility in Arabidopsis thaliana

Affiliations

Independent S-locus mutations caused self-fertility in Arabidopsis thaliana

Nathan A Boggs et al. PLoS Genet. 2009 Mar.

Abstract

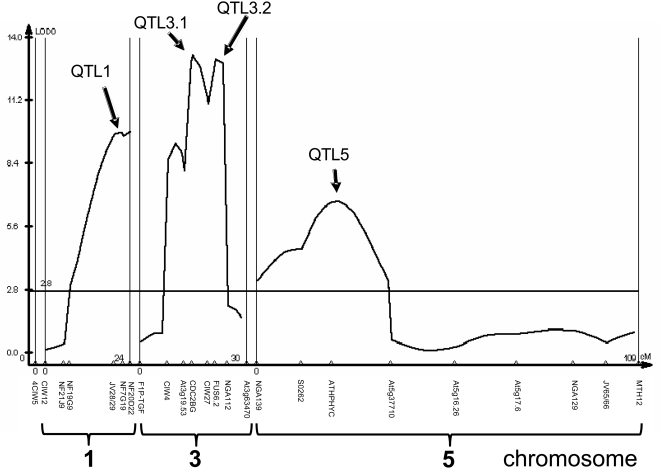
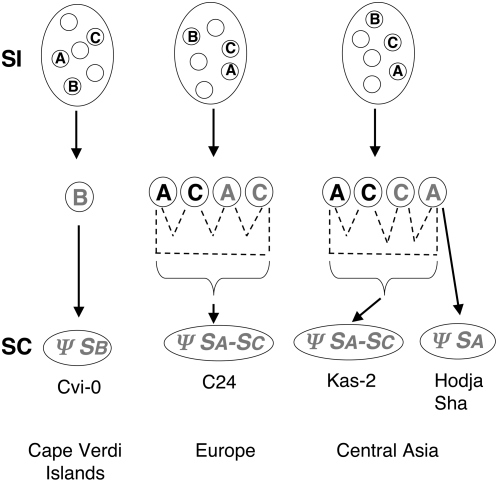
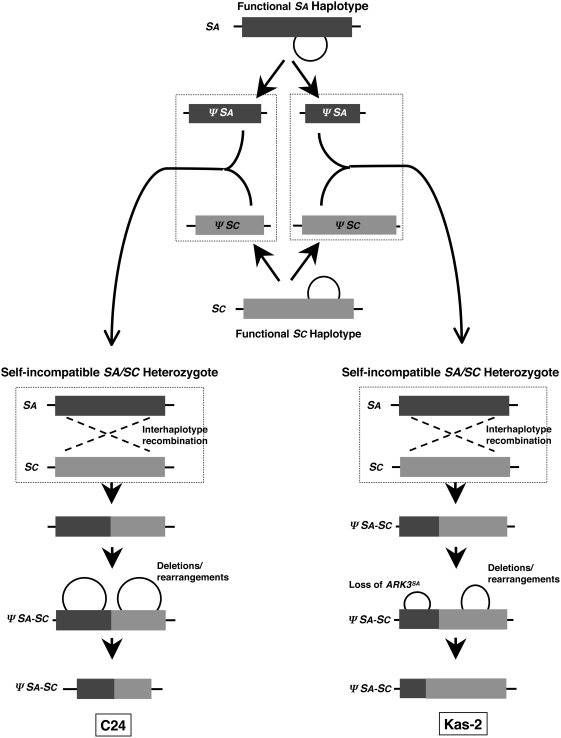
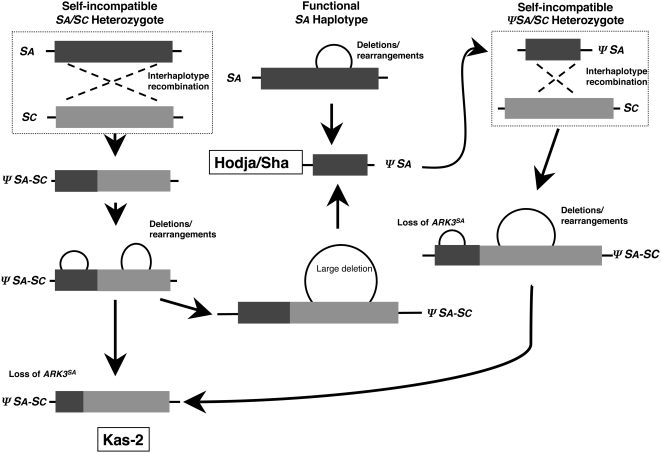
A common yet poorly understood evolutionary transition among flowering plants is a switch from outbreeding to an inbreeding mode of mating. The model plant Arabidopsis thaliana evolved to an inbreeding state through the loss of self-incompatibility, a pollen-rejection system in which pollen recognition by the stigma is determined by tightly linked and co-evolving alleles of the S-locus receptor kinase (SRK) and its S-locus cysteine-rich ligand (SCR). Transformation of A. thaliana, with a functional AlSRKb-SCRb gene pair from its outcrossing relative A. lyrata, demonstrated that A. thaliana accessions harbor different sets of cryptic self-fertility-promoting mutations, not only in S-locus genes, but also in other loci required for self-incompatibility. However, it is still not known how many times and in what manner the switch to self-fertility occurred in the A. thaliana lineage. Here, we report on our identification of four accessions that are reverted to full self-incompatibility by transformation with AlSRKb-SCRb, bringing to five the number of accessions in which self-fertility is due to, and was likely caused by, S-locus inactivation. Analysis of S-haplotype organization reveals that inter-haplotypic recombination events, rearrangements, and deletions have restructured the S locus and its genes in these accessions. We also perform a Quantitative Trait Loci (QTL) analysis to identify modifier loci associated with self-fertility in the Col-0 reference accession, which cannot be reverted to full self-incompatibility. Our results indicate that the transition to inbreeding occurred by at least two, and possibly more, independent S-locus mutations, and identify a novel unstable modifier locus that contributes to self-fertility in Col-0.


Conflict of interest statement

The authors have declared that no competing interests exist.

Figures

Figure 1
Figure 1. DNA gel blot analysis of A. thaliana ΨS-locus sequences in various A. thaliana accessions.
A blot of EcoRI-digested genomic DNA was probed (as indicated underneath the blots) sequentially with ΨSRKA exon 7 derived from the Col-0 accession, ΨSRKC exon 7 derived from the Ita-0 accession, and the extracellular domain of ΨSRKC (ΨeSRKC) also derived from the Ita-0 accession. A Nok-3 x C24 hybrid was used to assess Nok-3 S-locus polymorphisms because at the time of producing the blot, there was no pure Nok-3 DNA available. Nok-3 was determined to have sequences corresponding to ΨSRKC exon 7, similar to C24, because when probed with this fragment, the Nok-3 x C24 hybrid exhibits two hybridizing bands, whereas C24 exhibits only one.
Figure 2
Figure 2. ΨS-locus structure in Col-0 and accessions that express a developmentally-stable transgenic SI response.
The ΨS-locus genes and gene fragments in the Col-0, C24, Kas-2, Sha, Hodja, and Cvi-0 accessions are shown. ΨSRKA, ΨSCR1, and ARK3SA genes are shown in grey, ΨSRKC and ARK3SC genes are shown in white, and ΨSB genes are shown as boxes filled with vertical stripes. Arrows shown inside genetic elements illustrate the 5′ to 3′ orientation of the sequences, and black teeth marks indicate 5′ and 3′ gene truncations. In the Col-0 and C24 ΨS haplotypes, the boxes filled with horizontal stripes indicate insertions within the ΨSCR1 and ΨSRKA sequences. In the C24 haplotype, the asterisk marks the deleted ΨARK3 sequence unique to C24, and the vertical arrow shows the location of the recombination event between SA and SC haplotypes that produced this haplotype. In the Kas-2 and Sha/Hodja ΨS loci, the hatch marks between genes or gene fragments indicate that the distance, orientation, and order of ARK3 and ΨS-locus sequences is not known. Arrows above ΨSCR1 in Col-0 and the ΨeSRKA fragment in C24 indicate the overall orientation of the pseudogenes . The ΨS-locus genes are not drawn to scale.
Figure 3
Figure 3. Complete sequence of the A. thaliana Ψ SCR1 second exon.
(A) DNA and primary amino-acid sequence of the Columbia ΨSCR1 first exon, intron, and rearranged second exon. The first half of the second exon ends at the “KED” amino acid sequence shown in bold . The insertion after “KED” is marked by the dotted line. The second half of the ΨSCR1 second exon has been inverted in relation to the rest of ΨSCR1. The “DEK” at the end of the sequence is an inverted duplication of the “KED” shown before the insertion. (B) Amino-acid sequence alignment of the second exons of A. lyrata SCRa, AlSCR37, and ΨSCR1. The underlined portions and the dotted line show the sequences that have been inverted in ΨSCR1 relative to AlSCR37. The nucleotide sequence of AlSCR37 is shown in Figure S1.
Figure 4
Figure 4. Fruit-length distribution in the QTL mapping population derived from the C24::AlSRKb-SCRb x Col-0 cross.
A total of 186 individuals were measured for their average fruit length. The normal distribution observed (with a slightly positive skew) is indicative of a multigenic trait, with each gene having an additive effect on the trait value. The average fruit-length values for the self-incompatible (SI) and self-compatible (SC) parents of the mapping population are shown at the lower and upper ends of the distribution, respectively. Fully self-incompatible plants in this population have average fruit-length values equivalent to those of the self-incompatible parent (see text).
Figure 5
Figure 5. QTL analysis of plants derived from the C24::AlSRKb-SCRb X Col-0 cross.
The graph shows the QTL identified by their effect on average fruit length. The x axis shows the distance between markers in centiMorgans (cM) for each chromosome and the identity and relative position of these markers are shown below the x axis. The y axis is shown as a LOD (logarithm of odds) score for each position on the x axis. Although all QTL were found to fall well above the empirically-determined significance threshold (shown by the horizontal line), only QTL3.2 on chromosome 3 has been directly associated with breakdown of SI in this population. The peak to the left of QTL3.1 was not classified as a QTL because the “trough” separating the two peaks was not sufficiently deep (2-LOD interval).
Figure 6
Figure 6. Proposed paths for generation of extant ΨS haplotypes from ancestral S haplotypes in different geographical locations.
In the diagram, functional and non-functional ΨS haplotypes S haplotypes are depicted in black and grey letters, respectively. Ovals in the top row represent ancestral self-incompatible (SI) populations harboring multiple S haplotypes (small circles), including SA, SB, and SC (A, B, and C). The SA, SB, and SC haplotypes are shown to have undergone independent inactivation in different geographical locations. In the Cape Verdi islands, this process would have produced ΨSB. In southwestern Europe and central Asia, SA-SC inter-haplotypic recombination events (dashed lines) would have occurred in S-locus heterozygotes, either between functional haplotypes (generating a non-functional recombinant haplotype) or after inactivation of one or both S haplotypes, to produce the C24 and Kas-2 ΨSA-SC recombinant haplotypes. The double-headed arrow reflects the uncertain relationship between the Kas-2 ΨSA-SC and the Hodja/Sha ΨSA haplotypes: the latter might have arisen independently by decay of an ancestral SA haplotype or it might have been derived from a Kas-2-like ΨSA-SC haplotype by loss of SC sequences.
Figure 7
Figure 7. Scenarios for the independent origin of the C24 and Kas-2 ΨSA-SC recombinant haplotypes.
The diagram illustrates how the C24 and Kas-2 ΨS haplotypes might have been generated by independent events occurring in distinct individuals. The individuals in which the postulated recombination events occurred are framed by dashed boxes. Deletions and rearrangements are shown by circles. Two possibilities are shown. (1) In the left and right diagrams, distinct crossover events between SA and SC haplotypes occur in different self-incompatible heterozygous individuals causing S-locus inactivation; subsequent restructuring by deletions and rearrangements generates the C24 (left) and the Kas-2 ΨSA-SC haplotypes (right). (2) In the center diagram, SA and SC haplotypes are inactivated by distinct restructuring events to generate different versions of ΨSA and ΨSC haplotypes. Subsequent crossover events in self-fertile heterozygous individuals carrying different combinations of these non-functional haplotypes then generate the C24 and Kas-2 ΨSA-SC haplotypes.
Figure 8
Figure 8. Scenarios for the origin of the Kas-2 and Hodja/Sha ΨS haplotypes.
The diagram illustrates how the Hodja/Sha and Kas-2 ΨS haplotypes might have been generated by independent events occurring in distinct individuals and how these haplotypes might have been produced from shared ΨS-locus intermediate configurations. The individuals in which the postulated recombination events occurred are framed by dashed boxes. Deletions and rearrangements are shown by circles. To the left, the Kas-2 ΨSA-SC is generated as in Figure 7. In the center, the Hodja/Sha ΨSA haplotype is generated either from deletions and rearrangements occurring in a functional SA haplotype (top) or from a progenitor of the Kas-2 ΨSA-SC haplotype (bottom). To the right, an alternative path for the generation of the Kas-2 ΨSA-SC haplotype involves a crossover event between a Hodja/Sha-like ΨSA haplotype and a functional SC haplotype.

References

    1. Goddard MR, Godfray HC, Burt A. Sex increases the efficacy of natural selection in experimental yeast populations. Nature. 2005;434:636–640. - PubMed
    1. Zeyl C, Bell G. The advantage of sex in evolving yeast populations. Nature. 1997;388:465–468. - PubMed
    1. Paland S, Lynch M. Transitions to asexuality result in excess amino acid substitutions. Science. 2006;311:990–992. - PubMed
    1. Barrett SC. The evolution of plant sexual diversity. Nat Rev Genet. 2002;3:274–284. - PubMed
    1. Stebbins GL. Self-fertilization and population variability in the higher plants. Am Nat. 1957;91:337–354.

Publication types