. 2009;4(3):e4905.
doi: 10.1371/journal.pone.0004905. Epub 2009 Mar 20.

Emergent genome-wide control in wildtype and genetically mutated lipopolysaccarides-stimulated macrophages

Affiliations

Emergent genome-wide control in wildtype and genetically mutated lipopolysaccarides-stimulated macrophages

Masa Tsuchiya et al. PLoS One. 2009.

Abstract

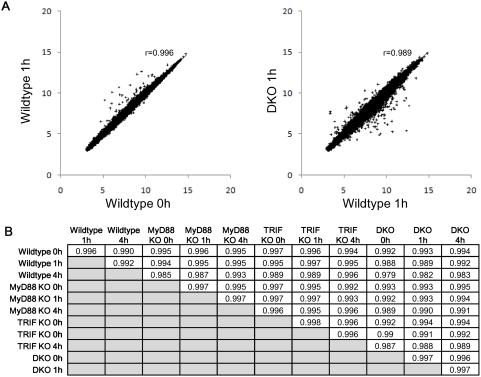
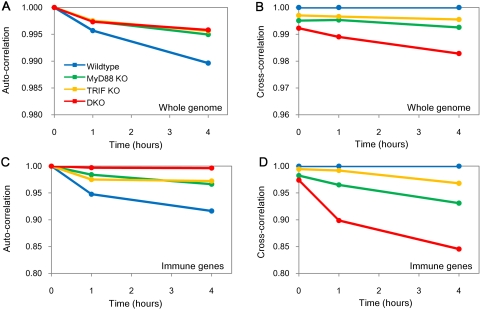
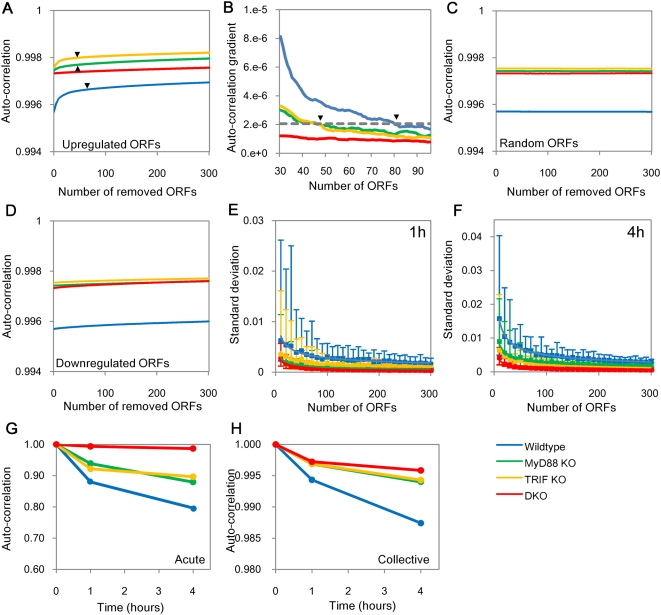
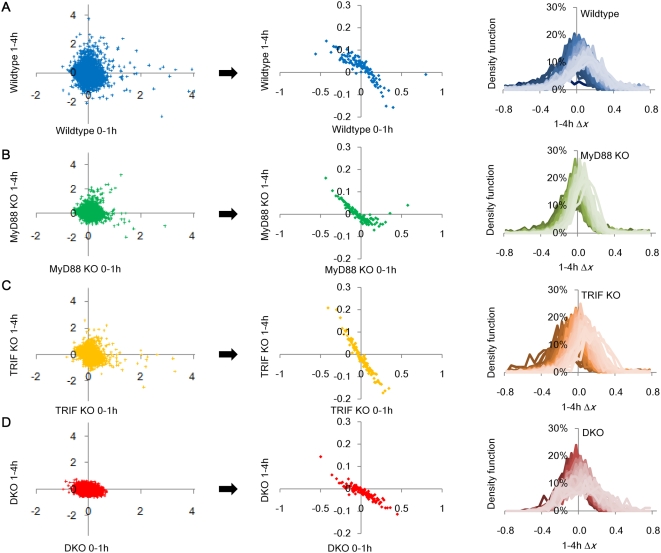
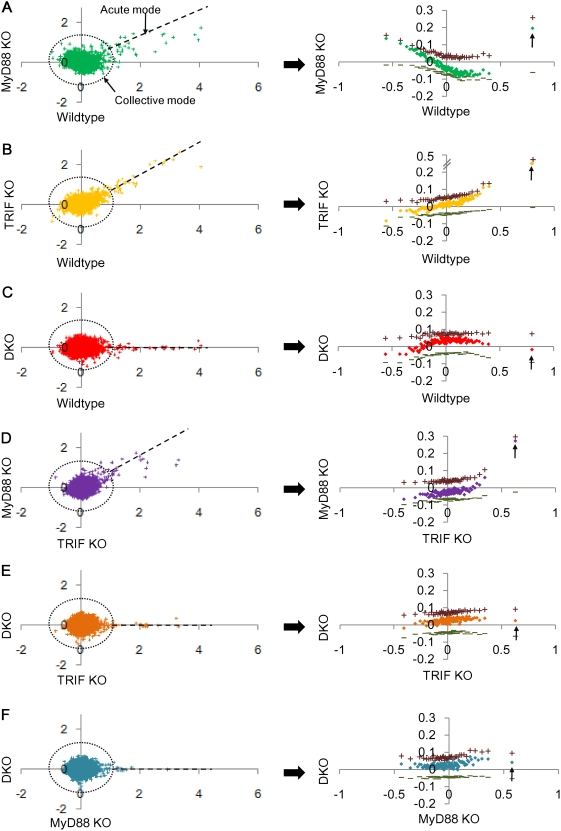
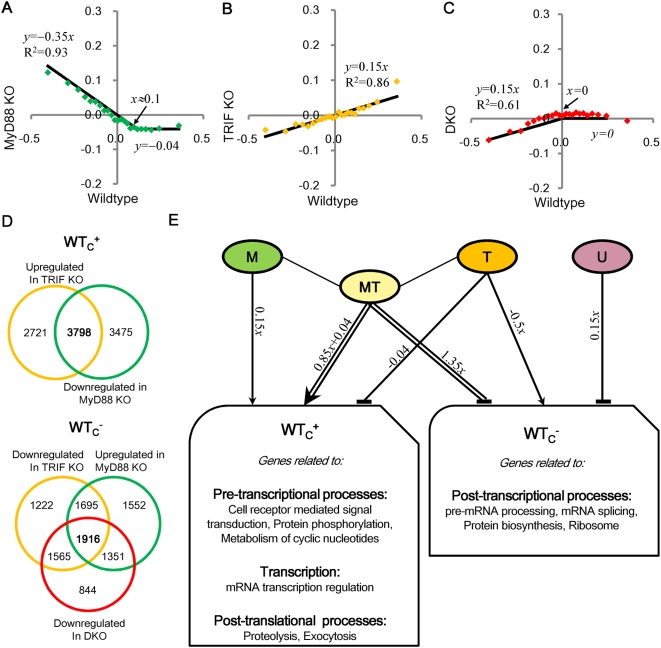
Large-scale gene expression studies have mainly focused on highly expressed and 'discriminatory' genes to decipher key regulatory processes. Biological responses are consequence of the concerted action of gene regulatory network, thus, limiting our attention to genes having the most significant variations is insufficient for a thorough understanding of emergent whole genome response. Here we comprehensively analyzed the temporal oligonucleotide microarray data of lipopolysaccharide (LPS) stimulated macrophages in 4 genotypes; wildtype, Myeloid Differentiation factor 88 (MyD88) knockout (KO), TIR-domain-containing adapter-inducing interferon-beta (TRIF) KO and MyD88/TRIF double KO (DKO). Pearson correlations computed on the whole genome expression between different genotypes are extremely high (>0.98), indicating a strong co-regulation of the entire expression network. Further correlation analyses reveal genome-wide response is biphasic, i) acute-stochastic mode consisting of small number of sharply induced immune-related genes and ii) collective mode consisting of majority of weakly induced genes of diverse cellular processes which collectively adjust their expression level. Notably, temporal correlations of a small number of randomly selected genes from collective mode show scalability. Furthermore, in collective mode, the transition from large scatter in expression distributions for single ORFs to smooth linear lines emerges as an organizing principle when grouping of 50 ORFs and above. With this emergent behavior, the role of MyD88, TRIF and novel MyD88, TRIF-independent processes for gene induction can be linearly superposed to decipher quantitative whole genome differential control of transcriptional and mRNA decay machineries. Our work demonstrates genome-wide co-regulated responses subsequent to specific innate immune stimulus which have been largely neglected.


Conflict of interest statement

Competing Interests: The authors have declared that no competing interests exist.

Figures

Figure 1
Figure 1. Simplified overview of LPS-induced signaling.
LPS binds with TLR4 and activates transcription factors AP-1, NF-κB and IRF3 through MyD88- and TRIF- dependant pathways. This leads to the induction of proinflammatory cytokines and interferons. Figure modified from Akira et al. (2006).
Figure 2
Figure 2. Genome-wide invariance between wildtype, single and double KOs.
Highly correlated gene expressions between genotypes, and between time points. A) Left panel: wildtype 0 h (x-axis) vs. wildtype 1 h (y-axis), right panel: wildtype 1 h (x-axis) vs. DKO 1 h (y-axis). Other combinations of genotype and time points also show similar correlations (data not shown). Each point in the plot represents the expression of a single ORF. B) Whole genome Pearson correlations between samples.
Figure 3
Figure 3. Temporal Pearson correlation reveals genotype differences.
A) Auto- and B) cross-correlations for whole genome (22690 ORFs). C) Auto- and D) cross-correlations for immune-related genes. See maintext for details. Immune-related genes constitute 157 well-known genes induced during immune and inflammatory response (obtained from GenMAPP [20]).
Figure 4
Figure 4. LPS induces biphasic acute-stochastic and collective modes of response in wildtype and single KOs but not DKO.
A) Auto-correlation profiles of all genotypes when removing one by one up to 300 ORFs highest upregulated ORFs from 0 to 1 hr (in terms of expression change: Δx = x(1 h)−x(0 h)). B) Plot of average auto-correlations slopes of 0–1 h in A). Since DKO possesses only collective mode, we used average slope of DKO curve at N = 10 to distinguish biphasic transition (dotted gray line). Wildtype and single KO cross this slope at about N = 80 and N = 50 ORFs, respectively. This biphasic transition point further suggests collective mode. No biphasic behavior was found for C) randomly selected or D) downregulated ORFs. Confirmation of collective mode: E) Standard deviation (SD) of auto-correlation (0–1 h) of groups of randomly chosen ORFs in steps of 10 up to 300 from whole genome. Each point represents average SD of 30 groups, error bars represent highest and lowest SD. F) As in E) for 1–4 h auto-correlation. G) Auto-correlations of 80 highly expressed ORFs representing acute-stochastic mode in the wildtype. H) Average auto-correlations of 30 extractions of 80 randomly chosen ORFs in the wildtype collective mode.
Figure 5
Figure 5. Emergence of regulatory signature from scattered expressions.
Genome-wide expression changes (Δx) between time points, 0–1 h (x-axis) vs. 1–4 h (y-axis) for single ORF (left panels) in A) wildtype, B) MyD88 KO, C) TRIF KO), and D) DKO. Center panels: corresponding plots for group of 200 ORFs sorted by their 0–1 h expression change (x-axis). Each point represents the average of Δx for 200 ORFs. Right panels: Gaussian distribution of Δx for 1–4 h. Superposed profiles (lighter color for increasing upregulated groups and darker color for increasing downregulated groups) represent density distribution (Gaussian) of each group of 200 ORFs sorted from highest to lowest for 0–1 h in A) wildtype, B) MyD88 KO, C) TRIF KO and D) DKO. x-axis represents Δx for 1–4 h and y-axis represents the density of ORFs.
Figure 6
Figure 6. Large scatter in collective mode and linear distribution in acute-stochastic mode.
Genome-wide single ORFs (left panels) expression changes (Δx) for 0–1 h between genotypes: wildtype vs. A) MyD88 KO, B) TRIF KO, C) DKO; TRIF KO vs. D) MyD88 KO and E) DKO; F) MyD88 KO vs. DKO. Right panels: corresponding plots for group of 200 ORFs, sorted by their expression change in the corresponding genotype (x-axis). + and − indicate average of expression change of the upregulated and downregulated ORFs in each group, respectively. Arrows indicate groups containing the acute-stochastic mode.
Figure 7
Figure 7. Global shifts in each genotype distribution.
Genome-wide expression changes (Δx) for groups of 200 randomly chosen ORFs between genotypes for 0–1 h: wildtype vs. A) MyD88 KO, B) TRIF KO, C) DKO.
Figure 8
Figure 8. Deciphering gene regulatory mechanisms from the emergent signature.
Linear regressions of genome-wide expression changes (Δx) between genotypes after the removal of global shifts in Figure 7: A) wildtype vs. MyD88 KO, B) wildtype vs. TRIF KO, C) wildtype vs. DKO, for group of 1000 ORFs, sorted from highest to lowest expressions change in wildtype. Each point represents the average expression changes of 1000 ORFs (see Methods). Distributions are approximated to linear equations represented by y = αx+β (main text) so as to obtain best fit. Flat distributions are fitted to the average of their points (R 2 = 0). D) Gene clustering. The 3798 ORFs upregulated in TRIF KO and downregulated in MyD88 KO for WTc + (top panel) and the 1916 ORFs downregulated in TRIF KO and DKO, and upregulated in MyD88 KO for WTc (bottom panel) were selected to determine biological processes regulated in whole genome (see maintext). E) Individual effects of M, T, MT and U on the biological processes regulated in collective mode of WTc +and WTc . Arrows indicate activation through dominant transcription and T-shaped lines indicate repression through dominant mRNA decay.

References

    1. Akira S, Uematsu S, Takeuchi O. Pathogen recognition and innate immunity. Cell. 2006;124:783–801. - PubMed
    1. McKenna K, Beignon AS, Bhardwaj N. Plasmacytoid dendritic cells: linking innate and adaptive immunity. J Virol. 2005;79:17–27. - PMC - PubMed
    1. Uematsu S, Akira S. Toll-like receptors and Type I interferons. J Biol Chem. 2007;282:15319–15323. - PubMed
    1. Akira S, Takeda K, Kaisho T. Toll-like receptors: critical proteins linking innate and acquired immunity. Nat Immunol. 2001;2:675–680. - PubMed
    1. Finlay BB, McFadden G. Anti-immunology: evasion of the host immune system by bacterial and viral pathogens. Cell. 2006;124:767–782. - PubMed

Publication types

MeSH terms

Substances