. 2009:467:251-70.
doi: 10.1007/978-1-59745-241-0_15.

Measurement of angiogenic phenotype by use of two-dimensional mesenteric angiogenesis assay

Affiliations

Measurement of angiogenic phenotype by use of two-dimensional mesenteric angiogenesis assay

Andrew V Benest et al. Methods Mol Biol. 2009.

Abstract

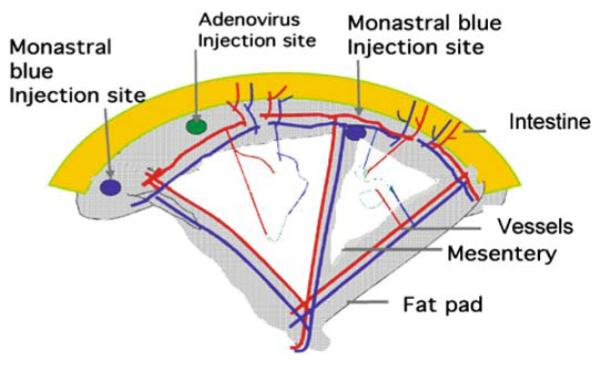
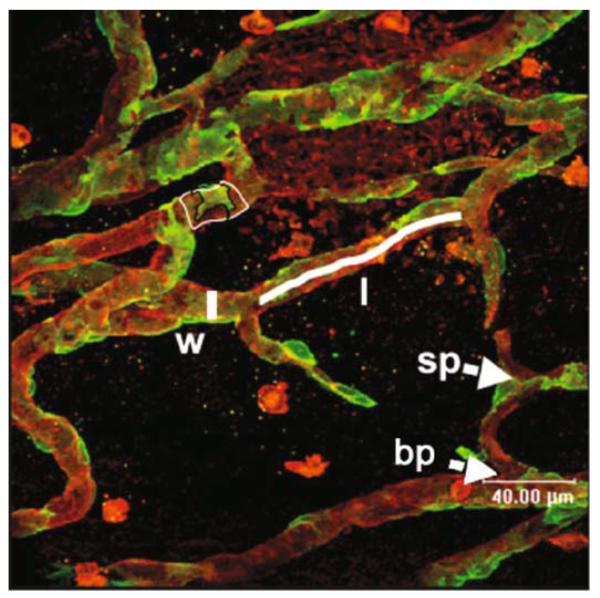
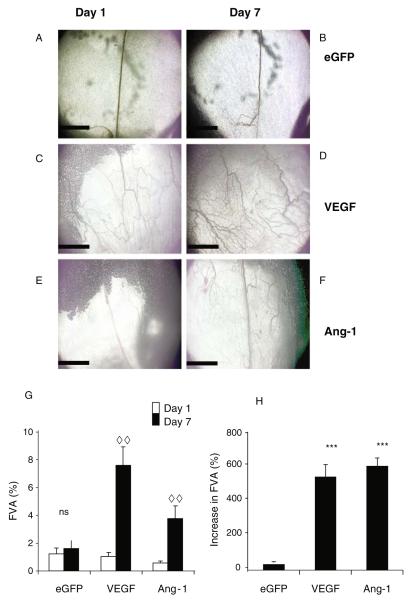
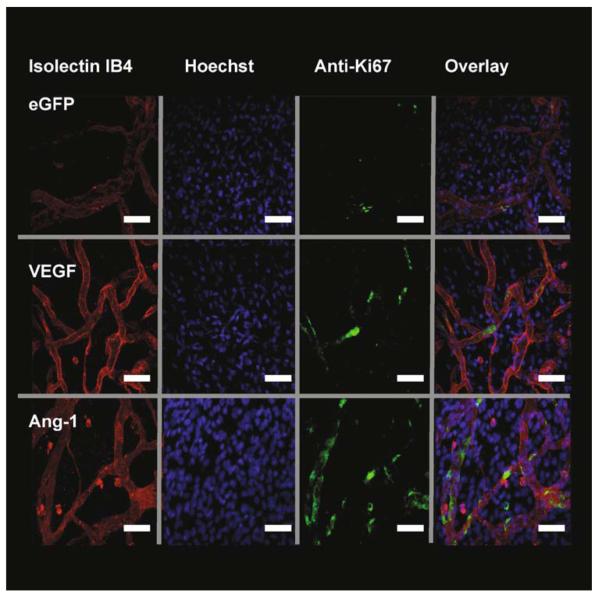
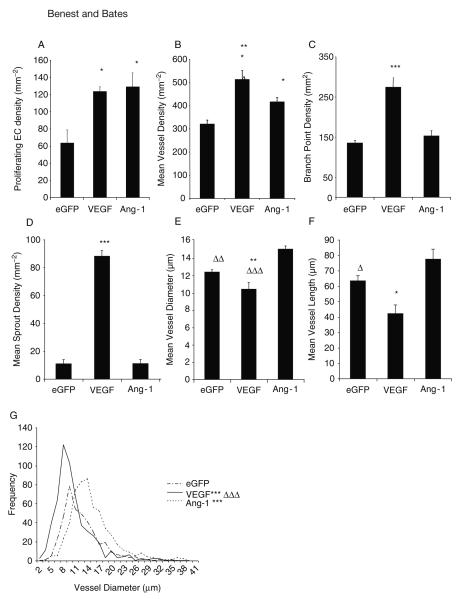
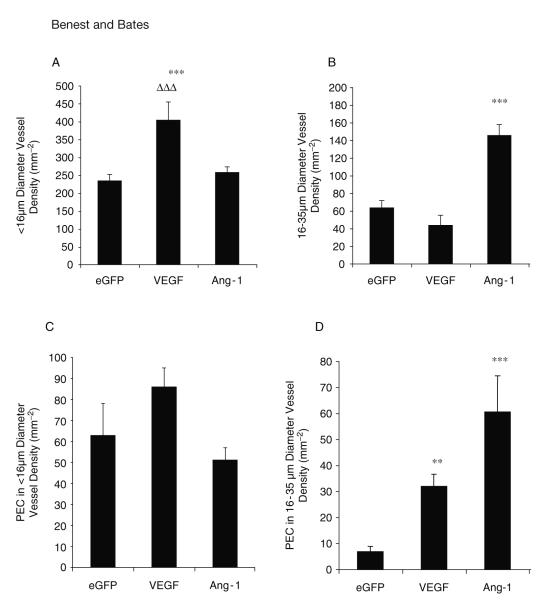
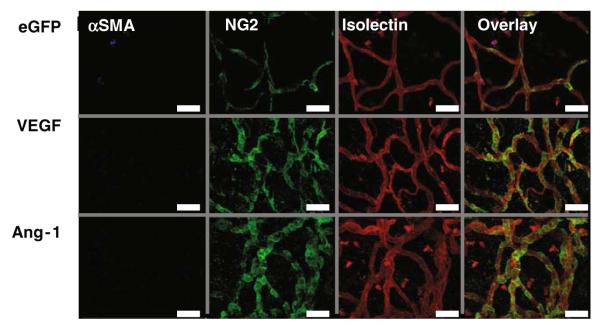
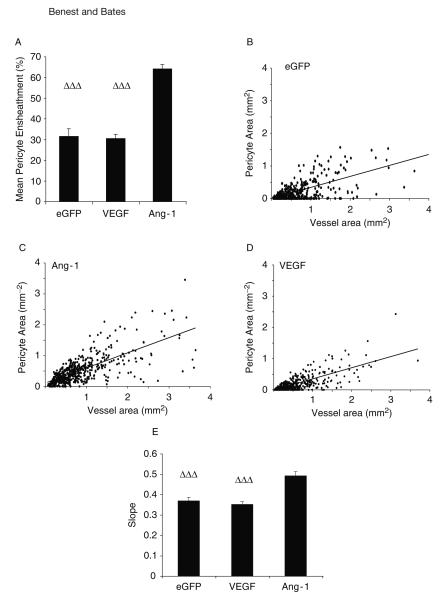
Successful therapeutic angiogenesis requires an understanding of how the milieu of growth factors available combine to form a mature vascular bed. This requires a model in which multiple physiological and cell biological parameters can be identified. The adenoviral-mediated mesenteric angiogenesis assay as described here is ideal for that purpose. Adenoviruses expressing growth factors (vascular endothelial growth factor [VEGF] and angiopoietin 1 [Ang-1]) were injected into the mesenteric fat pad of adult male Wistar rats. The clear, thin, and relatively avascular mesenteric panel was used to measure increased vessel perfusion by intravital microscopy. In addition, high-powered microvessel analysis was carried out by immunostaining of features essential for the study of angiogenesis (endothelium, pericyte, smooth muscle cell area, and proliferation), allowing functional data to be obtained in conjunction with high-power microvessel ultrastructural analysis. A combination of individual growth factors resulted in a distinct vascular phenotype from either factor alone, with all treatments increasing the functional vessel area. VEGF produced shorter, narrow, highly branched, and sprouting vessels with normal pericyte coverage. Ang-1 induced broader, longer neovessels with no apparent increase in branching or sprouting. However, Ang-1-induced blood vessels displayed a significantly higher pericyte ensheathment. Combined treatment resulted in higher perfusion, larger and less-branched vessels, with normal pericyte coverage, suggesting them to be more mature. This model can be used to show that Ang-1 and VEGF use different physiological mechanisms to enhance vascularisation of relatively avascular tissue.


Figures

Fig. 15.1
Fig. 15.1
A schematic representation of rat mesenteric angiogenesis assay demonstrating the intestine (grey), the fat pad (shingle), the transparent mesentery (white). Within the mesenteric panel are the microvessels, showing approximately equal distributions of pre-, post-, and true capillary order vessels. The adenovirus is injected into the fat pad (marked checked circle), and the panel is located by placing a tattoo on either side of the injected panel.
Fig. 15.2
Fig. 15.2
Measurement of microvascular parameters on stained mesenteries. Red isolectin-stained vessels, green NG2-stained pericytes. Parameters of width (measured line by w), length (measured line by l), sprouts (sp), branches (bp), and pericyte coverage (delineated green divided by delineated red areas by pc). Note that the pericytes can be seen right up to the tips of the sprouts (grey arrowhead).
Fig. 15.3
Fig. 15.3
Intravital images of mesenteric panels before and after growth factor overexpression (A–F). Intravital images obtained by −4 objective lens of patent vessels. Vessels on d 1 (A, C, E) and the same vessels imaged 6 d later (B,D,F). Vessels are visible due to the contrast of the blood flow. An increase in functional vessel area (FVA) is determined by an increase in patent vessel area (G), the magnitude of this increase is measured in H. ***p < 0.001 versus enhanced green fluorescent protein (eGFP), analysis of variance (ANOVA), ..p < 0.01 d 1 versus d 7, t-test. Scale bar 1 mm, n = 5 all groups, mean ± standard error of the mean (SEM). Ang-1 angiopoietin 1, VEGF vascular endothelial growth factor
Fig. 15.4
Fig. 15.4
Growth factor expression stimulates endothelial cell (EC) proliferation. Fluorescent staining of mesenteries after injection of adenovirus-enhanced green fluorescent protein (Ad-EGFP) (control) or Ad-growth factors. Isolectin IB4-TRITC (red) stains endothelial cells ECs, Hoechst 33324 (blue) stains all mesenteric nuclei and antibodies to Ki67-AF488 (green) to detect proliferating cells. Overlaying of the stack images is used to calculate the number of proliferating endothelial cells (PECs). Images are triple stained with TRITC-streptavidin and biotinylated GSL lectin IB4 (EC, red). Alexa Fluor 488-labeled goat antimouse immunoglobulin G and mouse monoclonal anti-Ki67 antibody (proliferating cells, green) and overlay. The PECs can be distinguished from other cells by their position within the vessel wall. White arrow demonstrates a PEC. VEGF vascular endothelial growth factor. Scale bar 40 μm
Fig. 15.5
Fig. 15.5
Vascular endothelial growth factor (VEGF) and angiopoietin 1 (Ang-1) are proangiogenic, yet result in different vessel phenotypes. Analysis of blood vessel parameters, from confocal stack data of mesenteries stained for lectin, Hoechst, and Ki67. Analysis of proliferation data (A), microvessel density (B), branch point (C), and sprout point (D) revealed that VEGF induced a hyperplasic response, but Ang-1 increased proliferation, but vessel density only increased by a moderate degree. Additional analysis of microvessels from confocal data. VEGF reduced vessel diameter and vessel length, reflective of increases in branching and sprouting (A, B). Consistent with increased branching and sprouting, Ang-1 increased mean vessel diameter (E) but did not alter vessel length (F). VEGF produced shorter vessels, and Ang-1 produced longer ones. Frequency histogram of mean vessel diameters of each vessel measured demonstrates a significant difference in the distribution of each treatment group (G). *p < 0.05, ***p < 0.001 versus enhanced green fluorescent protein (EGFP), Δ p < 0.05, .. p < 0.01, … p < 0.001 versus Ang-1. All values shown are mean ± standard error of the mean (SEM), n = 5. EC endothelial cell
Fig. 15.6
Fig. 15.6
Different growth factors preferentially produce and activate different subtypes of vessel. Vascular endothelial growth factor (VEGF) stimulated the generation of sub-16-μm diameter vessels compared with angiopoietin 1 (Ang-1) or green fluorescent protein (GFP) (A). Ang-1 transfections stimulated the generation of 16- to 35-μm diameter vessels to a greater extent than enhanced GFP (eGFP) or VEGF (B).In larger vessels, VEGF and Ang-1 stimulated endothelial proliferation, Ang-1 to a greater extent (C), whereas in smaller vessels endothelial cell proliferation was not increased (D). All values shown are mean ± standard error of the mean (SEM), n = 5. *p < 0.05, **p < 0.01, ***p < 0.001 versus EGFP, … p < 0.001 versus Ang-1. PEC proliferating endothelial cells
Fig. 15.7
Fig. 15.7
Growth factor expression stimulates endothelial cell (EC) proliferation. Fluorescent staining of mesenteries after injection of adenovirus-enhanced green fluorescent protein (Ad-EGFP) (control) or Ad-growth factors. Isolectin IB4-TRITC (red) stains ECs, Hoechst 33324 (blue) stains all mesenteric nuclei and antibodies to Ki67-AF488 (green) to detect proliferating cells. Overlaying of the stack images is used to calculate the number of proliferating endothelial cells (PECs). Images are triple stained with TRITC-streptavidin and biotinylated GSL lectin IB4 (ECs, red). Alexa Fluor 488-labeled goat antimouse immunoglobulin G and mouse monoclonal anti-Ki67 antibody (proliferating cells, green) and overlay. The PECs can be distinguished from other cells by their position within the vessel wall. White arrow demonstrates a PEC. Scale bar 40 μm. SMA smooth muscle area
Fig. 15.8
Fig. 15.8
Angiopoietin 1 (Ang-1) enhances the association between pericyte and blood vessel area. The area of each blood vessel covered by pericyte (fractional pericyte area, A) is increased by Ang-1 but is not changed between enhanced green fluorescent protein (eGFP) or vascular endothelial growth factor (VEGF). Correlation analysis between vessel area and pericyte area eGFP (B), Ang-1(C), VEGF(D). Comparison of the slope by analysis of variance (ANOVA) reveals Ang-1 has a greater association (E), that is, larger vessels have a better pericyte coverage. … p < 0.001 versus Ang-1. All values shown are mean ± standard error of the mean (SEM), n = 5

References

    1. Wang JF, Zhang X, Groopman JE. J Biol Chem. 2004;279:27088–27097. - PubMed
    1. Woolard J, Wang WY, Bevan HS. Cancer Res. 2004;64:7822–7835. - PubMed
    1. Rissanen TT, Markkanen JE, Gruchala M. Circ Res. 2003;92:1098–1106. - PubMed
    1. Vajanto I, Rissanen TT, Rutanen J. J Gene Med. 2002;4:371–380. - PubMed
    1. Visconti RP, Richardson CD, Sato TN. Proc Natl Acad Sci U S A. 2002;99:8219–8224. - PMC - PubMed

Substances

LinkOut - more resources