. 2009 Apr;49(4):1010-24.
doi: 10.1021/ci800426u.

Chemoinformatic analysis of combinatorial libraries, drugs, natural products, and molecular libraries small molecule repository

Affiliations

Chemoinformatic analysis of combinatorial libraries, drugs, natural products, and molecular libraries small molecule repository

Narender Singh et al. J Chem Inf Model. 2009 Apr.

Abstract

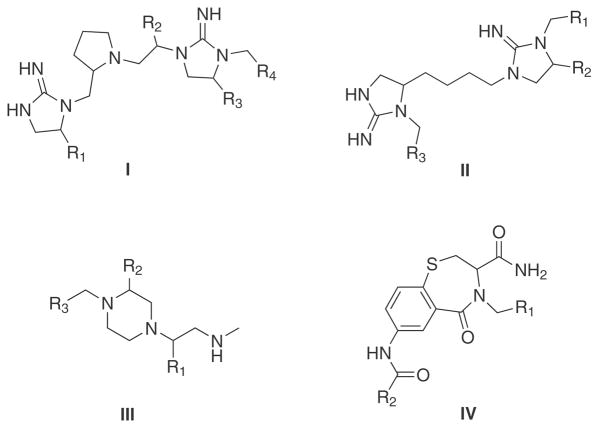
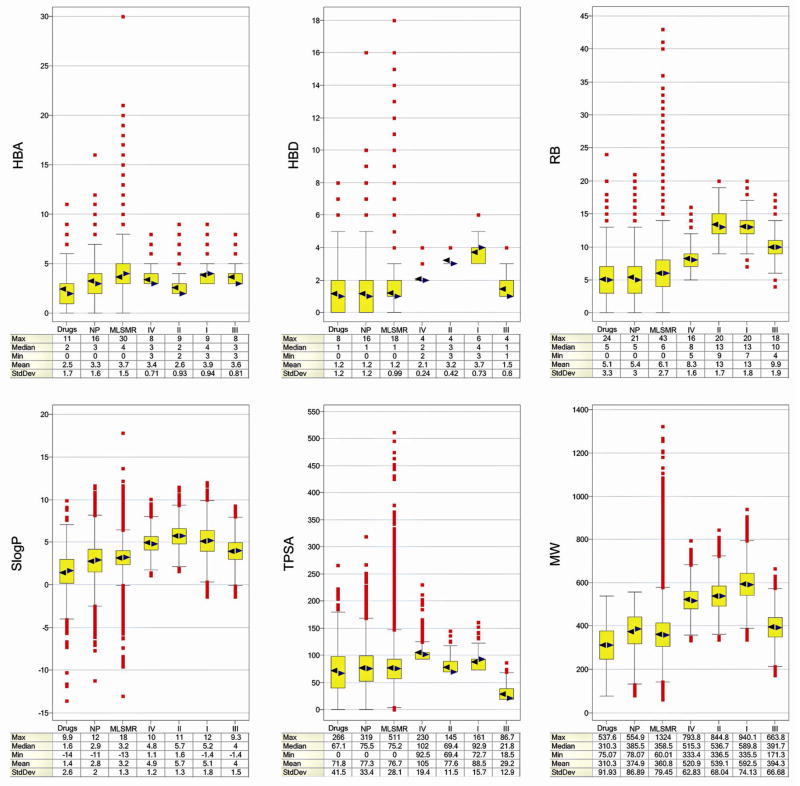
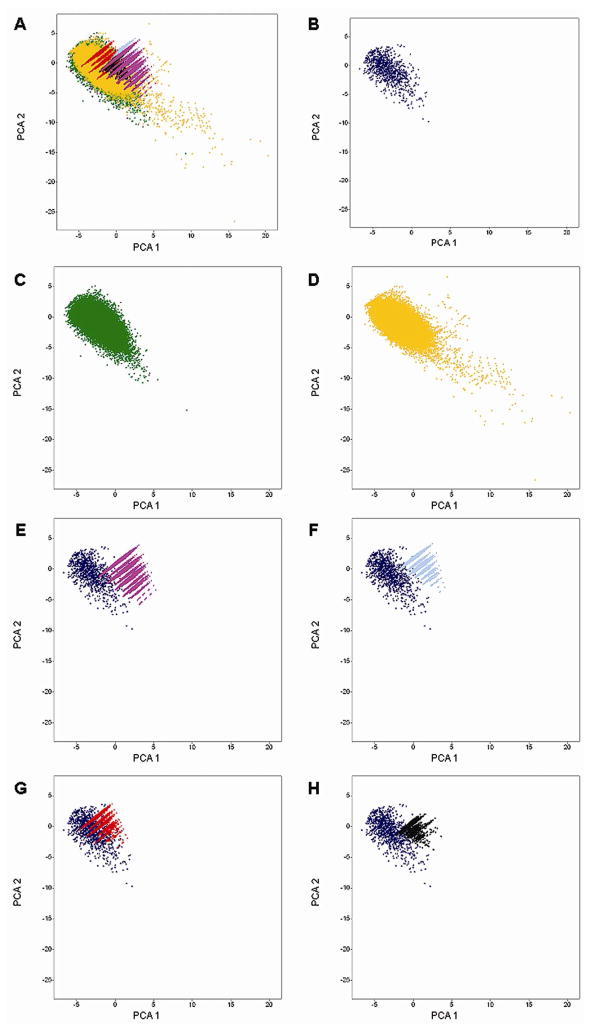
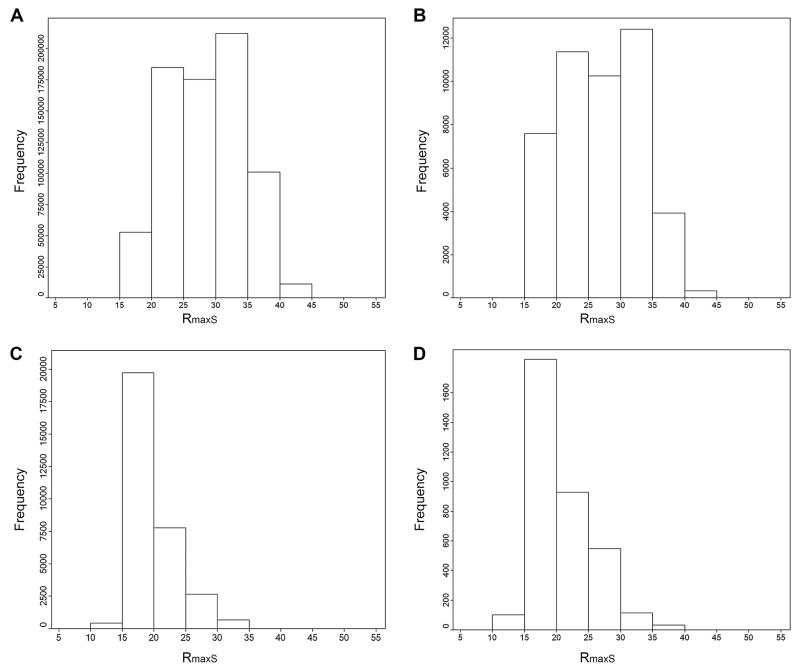
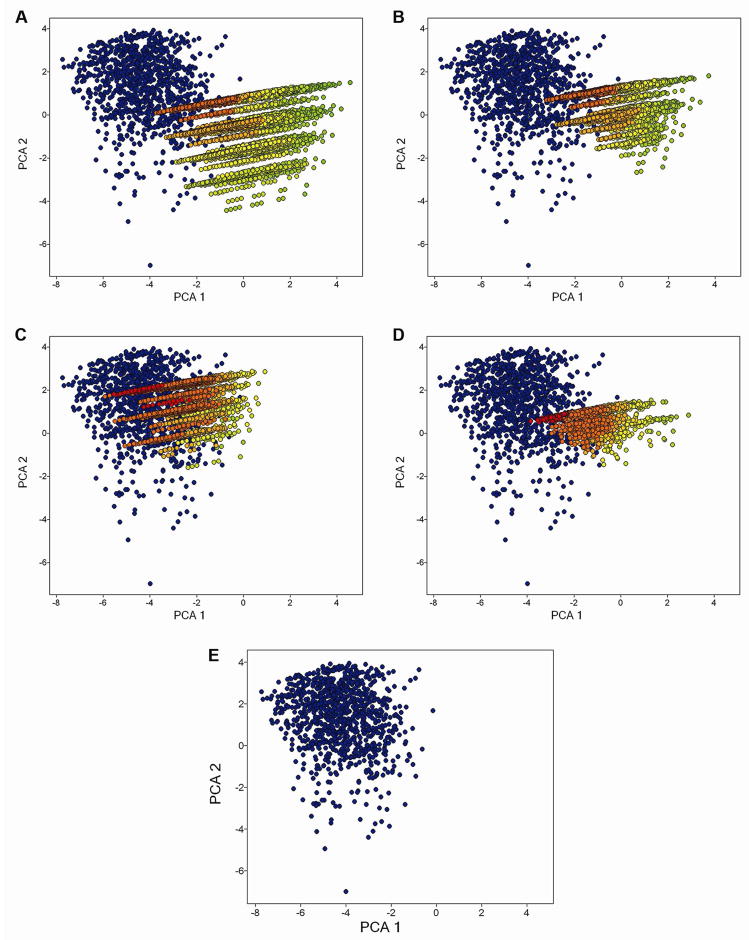
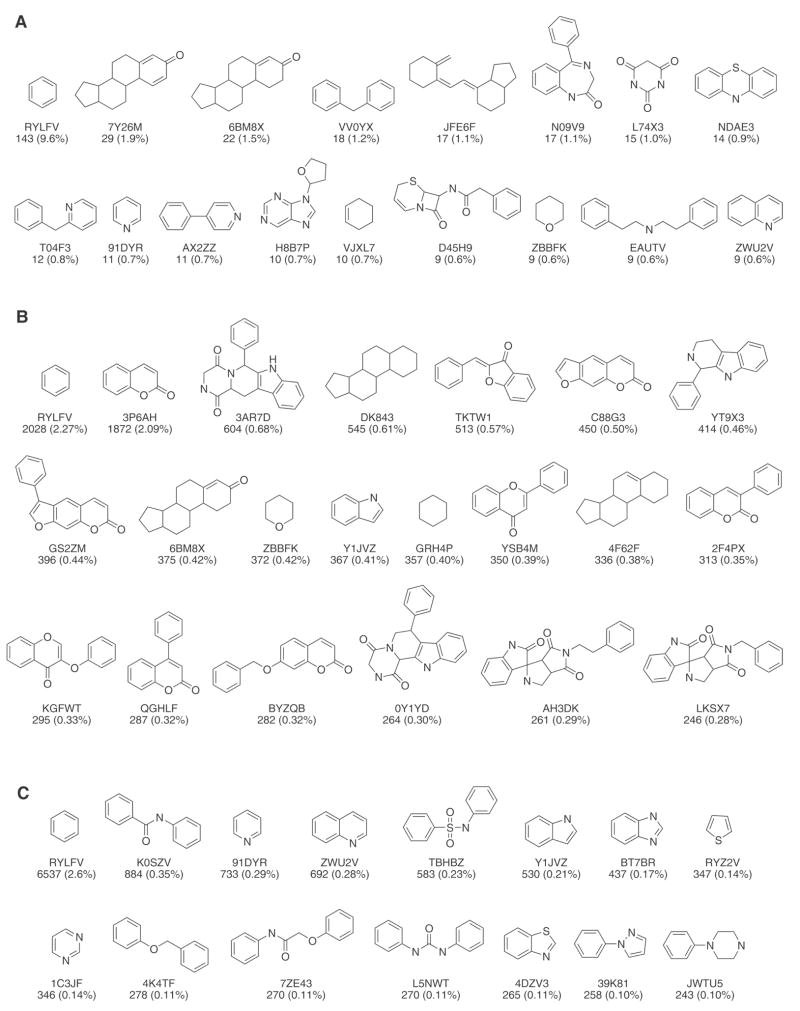
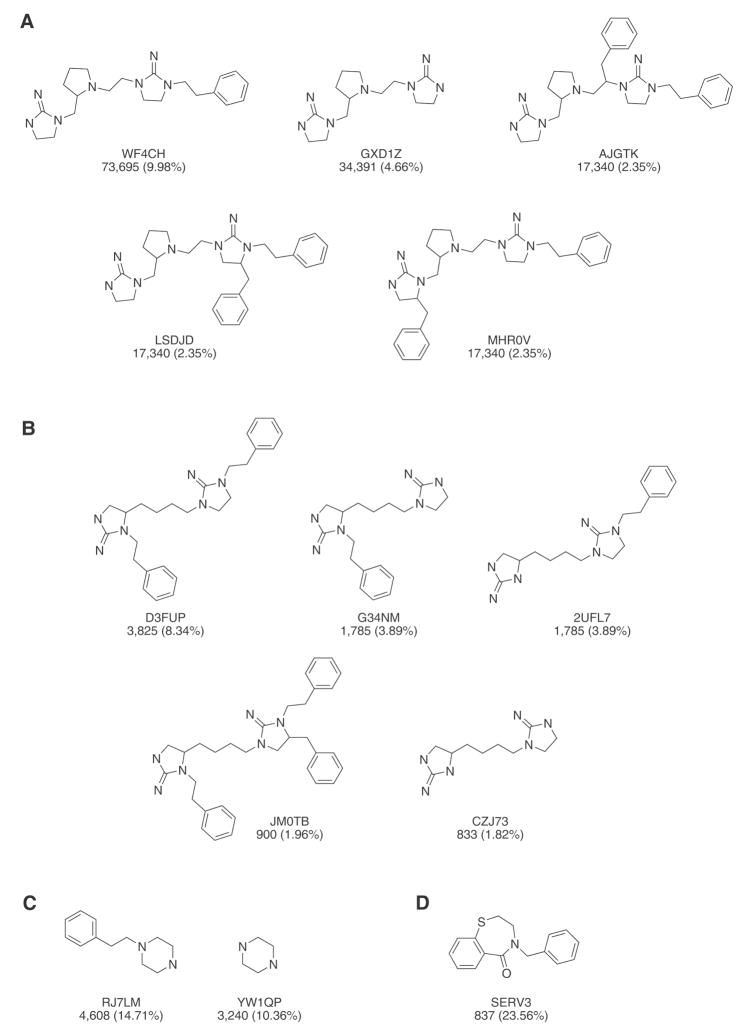
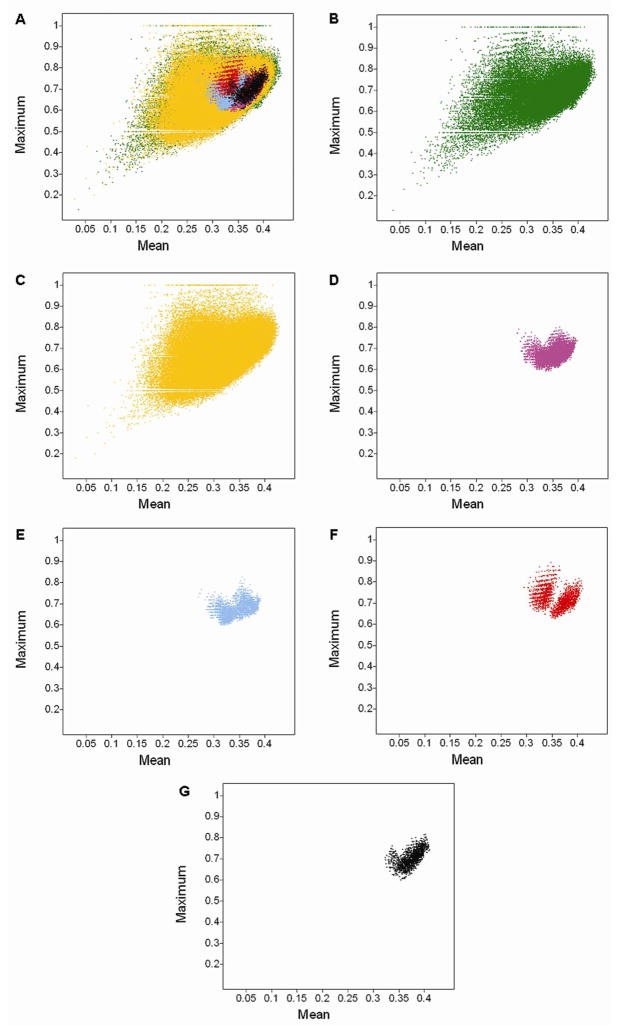
A multiple criteria approach is presented, that is used to perform a comparative analysis of four recently developed combinatorial libraries to drugs, Molecular Libraries Small Molecule Repository (MLSMR) and natural products. The compound databases were assessed in terms of physicochemical properties, scaffolds, and fingerprints. The approach enables the analysis of property space coverage, degree of overlap between collections, scaffold and structural diversity, and overall structural novelty. The degree of overlap between combinatorial libraries and drugs was assessed using the R-NN curve methodology, which measures the density of chemical space around a query molecule embedded in the chemical space of a target collection. The combinatorial libraries studied in this work exhibit scaffolds that were not observed in the drug, MLSMR, and natural products databases. The fingerprint-based comparisons indicate that these combinatorial libraries are structurally different than current drugs. The R-NN curve methodology revealed that a proportion of molecules in the combinatorial libraries is located within the property space of the drugs. However, the R-NN analysis also showed that there are a significant number of molecules in several combinatorial libraries that are located in sparse regions of the drug space.


Figures

Figure 1
Figure 1
Core templates of combinatorial libraries covered in this study. Library I is made up of 738,192 compounds (R1, R2, and R3 = 26 substituents, and R4 = 42 substituents). Library II is made up of 45,864 compounds (R1 = 42 substituents, R2 = 26 substituents, and R3 = 42 susbtituents). Library III is made up of 31,320 compounds (R1 = 29 susbtituents, R2 = 27 susbtituents, R3 = 40 susbtituents). Library IV is made up of 3,552 compounds (R1 = 48 substituents, R2 = 74 substituents).
Figure 2
Figure 2
Box plots for the physicochemical properties. The yellow boxes encloses data points with values within the first and third quartile; the black and blue triangles denote the mean and median of distributions, respectively; the lines above and below indicate the upper and lower adjacent values. The red squares indicate outliers.
Figure 3
Figure 3
Property space of seven libraries obtained by PCA of six (autoscaled) molecular descriptors. The first two PC account for 84.47% of the variance. The loadings are summarized in Table 2. (A) All libraries; (B) drugs; (C) natural products; (D) MLSMR; (E) drugs and library I; (F) drugs and library II; (G) drugs and library III; and (H) drugs and library IV.
Figure 4
Figure 4
Histograms of Rmax(S) values for the combinatorial libraries. The target collection was DrugBank. The plots were generated using the six scaled physicochemical descriptors. (A) Library I; (B) library II; (C) library III and (D) library IV.
Figure 5
Figure 5
Property space of drugs and four combinatorial libraries (820,418 molecules total) obtained by PCA of six scaled molecular descriptors. The first two PC account for 86.87% of the variance. Drugs are colored in blue. Combinatorial libraries are color-coded by the Rmax(S) value using a continuous scale from red (low Rmax(S) value) to green (high Rmax(S) value). Each panel depicts a different database: (A) drugs and library I; (B) drugs and library II; (C) drugs and library III; (D) drugs and library IV and (E) drugs.
Figure 6
Figure 6
Most frequent cyclic systems (molecular frameworks) found in (A) drugs, (B) natural products and (C) MLSMR collections studied in this work. Chemotype identifier, frequency and percentage are displayed.
Figure 7
Figure 7
Most frequent cyclic systems (molecular frameworks) derived from combinatorial libraries (A) I, (B) II, (C) III and (D) IV. Chemotype identifier, frequency and percentage are shown. Cyclic systems shown recover ~20% of each combinatorial library.
Figure 8
Figure 8
Multi-fusion similarity maps comparing six compound collections (test sets) to drugs (reference set) using MACCS keys. (A) All libraries; (B) natural products; (C) MLSMR; (D) library I; (E) library II; (F) library III; (G) library IV. A quantitative characterization of the plots is presented in Table 5.

References

    1. Scior T, Bernard P, Medina-Franco JL, Maggiora GM. Large Compound Databases for Structure-Activity Relationships Studies in Drug Discovery. Mini-Rev Med Chem. 2007;7:851–860. - PubMed
    1. Hopkins AL. Network Pharmacology: The Next Paradigm in Drug Discovery. Nat Chem Biol. 2008;4:682–690. - PubMed
    1. Austin CP, Brady LS, Insel TR, Collins FS. Molecular Biology: NIH Molecular Libraries Initiative. Science. 2004;306:1138–1139. - PubMed
    1. PubChem. [accessed Feb 21, 2009]. Available at: http://pubchem.ncbi.nlm.nih.gov.
    1. Irwin JJ, Shoichet BK. ZINC - a Free Database of Commercially Available Compounds for Virtual Screening. J Chem Inf Model. 2005;45:177–182. - PMC - PubMed

Publication types

MeSH terms

Substances