Review
. 2009 May;109(5):1948-98.
doi: 10.1021/cr030183i.

Functional nucleic acid sensors

Affiliations
Review

Functional nucleic acid sensors

Juewen Liu et al. Chem Rev. 2009 May.
No abstract available


Figures

Figure 1
Figure 1
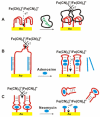
In vitro selection of a UO22+-specific DNAzyme. (A) The sequence of the DNA pool for the selection, which contained a 50 nucleotide random region (N50) and a cleavage site (rA). (B) Scheme of the selection procedures. (C) The secondary structure of clone 39 in the cis-cleaving form obtained right after selection. (D) The secondary structure of clone 39 after truncation and rational optimization in the trans-cleaving form. Reprinted with permission from Reference . Copyright 2007 the National Academy of Sciences.
Figure 2
Figure 2
Examples of metal-specific NAEs. In each figure, “N” represents any nucleotide provided they abide by Watson-Crick base pairing. All the NAEs contain an enzyme strand (in green) and one or two substrate strands (in black). Cleavage and ligation sites are marked in red. (A) The leadzyme: a Pb2+-dependent RNA-cleaving ribozyme. (B) The Pb2+-specific 8-17 DNAzyme. (C) The Zn2+-specific DNAzyme. U in blue denotes C5-imidazole-functionalized deoxyuridine. (D) The Cu2+-specific DNA-cleaving DNAzyme. Y denotes pyrimidine and R denotes purine. (E) Cu2+-specific DNA ligation DNAzyme. Im denotes an imidazole group.
Figure 3
Figure 3
Methods for designing NAE-based fluorescent sensors. (A) The general reaction scheme of a substrate cleaving NAE. (B) The operation principle of a molecular beacon for DNA detection. (C-G) Various methods in the literature for developing fluorescent NAE sensors (catalytic beacons). (H) Sensing with immobilized NAEs. In each scheme, the substrate, enzyme, and cleavage site are colored with black, green, and red, respectively.
Figure 4
Figure 4
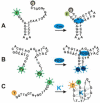
A catalytic beacon Pb2+ sensor. (A) The secondary structure of the Pb2+-specific DNAzyme. (B) Schematics of beacon signal generation. (C) Selectivity of the sensor. Inset: Kinetics of fluorescence increase with Pb2+ and other divalent metal ions. Reprinted with permission from Reference . Copyright 2006 American Chemical Society.
Figure 5
Figure 5
A catalytic beacon UO22+ sensor. (A) The secondary structure of the UO22+-specific DNAzyme. (B) Schematics of beacon signal generation. (C) Selectivity of the sensor. Inset: Kinetics of fluorescence increase with varying concentrations of UO22+ and UO22+ quantification. Reprinted with permission from Reference . Copyright 2007 the National Academy of Sciences.
Figure 6
Figure 6
A catalytic beacon Cu2+ sensor. (A) The secondary structure of the Cu2+-specific DNAzyme labeled with fluorophore and quenchers. (B) Schematics of beacon signal generation. (C) Selectivity of the sensor. The numbers represent metal concentrations in μM. Reprinted with permission from Reference . Copyright 2007 American Chemical Society.
Figure 7
Figure 7
Signaling performance of the 8-17 DNAzyme (boxed) modified with Alexa Fluorophores (AF) and QSY quenchers at various locations. (A-D) For each AF-QSY pair, 12 different substrates were prepared. Each design was tested on three parameters: max F/Fo (maximum fluorescence enhancement), Ymax (maximum percentage of cleavage), and t1/2 (the time required to reach half of the signaling maximum). Reprinted with permission from Reference . Copyright 2007 Oxford University Press.
Figure 8
Figure 8
(A) Schematic of in vitro selection of signaling DNAzymes. See text for descriptions. (B) Secondary structure of the DET22-18 DNAzyme. F and Q are fluorescein and Dabcyl, respectively. Reprinted with permission from Reference . Copyright 2003 American Chemical Society.
Figure 9
Figure 9
Sensing with a peroxidase DNAzyme for signal amplification. (A) Proposed secondary structure of the 18-nucleotide peroxidase DNAzyme (left); the DNAzyme can catalyze the conversion of luminol with chemiluminescence generation (middle) and the conversion of ABTS with color generation (right). DNA detection based on inhibited DNAzyme activity (B), opening a hairpin to free the DNAzyme domain (C), or with target DNA mediated DNAzyme immobilization and AuNPs for signal amplification (D). (E) Detection of M13 DNA by coupling PCR with the DNAzyme peroxidase reaction for signal amplification.
Figure 10
Figure 10
DNAzyme and AuNP-based colorimetric Pb2+ detection. (A) Pb2+-directed assembly of DNAzyme-linked AuNPs aligned in a head-to-tail manner. (B) UV-vis spectra of disassembled (red) and assembled (blue) AuNPs. (C) The assembly state or color of AuNPs in response to Pb2+ concentration. (D) Color of the AuNPs in the presence of different divalent metal ions. Reprinted with permission from Reference . Copyright 2003 American Chemical Society.
Figure 11
Figure 11
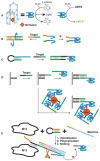
(A) Pb2+-directed assembly of DNAzyme-linked AuNPs aligned in a tail-to-tail manner. (B) Pb2+ detection based on Pb2+-induced disassembly of DNAzyme-linked AuNPs. Invasive DNA was used to accelerate the rate of color change. Reprinted with permission from Reference . Copyright 2005 American Chemical Society.
Figure 12
Figure 12
Electrochemical Pb2+ detection. (A) Schematics of the sensor design. (B) Metal-dependent sensor response. (C) Detection of Pb2+ in soil samples. Reprinted with permission from Reference . Copyright 2007 American Chemical Society.
Figure 13
Figure 13
Schematic presentation of a DNA aptamer selection process.
Figure 14
Figure 14
DNA aptamers against thrombin. (A) Schematic representation of the two sites on thrombin that interact with aptamers. (B) The 15-mer aptamer with a G-quadruplex structure targeting the fibrinogen-recognition exosite. (C) Aptamer with an additional duplex region targeting the fibrinogen-recognition exosite. (D) Aptamer targeting the heparin-binding exosite.
Figure 15
Figure 15
(A) The ATP-binding DNA aptamer with bound ATP. (B) An alternative way of drawing the aptamer in (A). (C) The ATP binding RNA aptamer. (D) Structure of ATP, AMP, and adenosine.
Figure 16
Figure 16
(A) Schematic representation of dye displacement by aptamer targets and the accompanying fluorescence decrease. Change of dye local environment led to fluorescence decrease. (B) An antisense DNA (in black) was used to form double-stranded DNA with the aptamer DNA (in red). Binding of thrombin (or in general, any target) can release the antisense DNA and the EB dye. Chemical structures of YOYO-1 iodide (YOYO) (C), YO-Pro-1 iodide (YO) (D), ethidium bromide (EB) (E), and a molecular light switching complex [Ru(phen)2(dppz)]2+ (F).
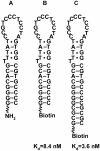
Figure 17
Figure 17
Sensors based on cationic conjugated polymers (CCP). (A) Structure of the CCP used in (B). (B) Fluorescent and colorimetric detection of thrombin (Thr) or K+. CCP and aptamer are positively and negatively charged, respectively. (C) Structure of the CCP used in (D). (D) Fluorescent detection of K+. Reprinted with permission from Reference . Copyright 2004 American Chemical Society.
Figure 18
Figure 18
(A) Schematics of competitive assays with labeled target molecules. Structures of farnesylated (B) or non-farnesylated (C) K-ras-based peptide.
Figure 19
Figure 19
Structures of acridine (A), fluorescein (B), bis-pyrene (C), Bodipy-FL at the 2′-ribose cytosine residue (D), and a PbS quantum dot (E). (F) 2′-amine substituted cytidine and its reaction with fluorescamine to form a stable fluorescent pyrrolinone.
Figure 20
Figure 20
Aptamer beacons. (A) Application of molecular beacons to probe single-stranded DNA binding proteins (SSB). (B) Detection of thrombin with an aptamer beacon. The aptamer contained an extension (in black), which formed the stem part of the hairpin. Binding to thrombin opened the hairpin and increased fluorescence.
Figure 21
Figure 21
Aptamer beacons with non-classical molecular beacon design. (A) An aptamer beacon for cocaine was constructed by labeling the two ends with a fluorophore and a quencher. (B) Two pyrenes (Py) were labeled on the two ends of a PDGF aptamer. Shifted emission wavelength was observed in the presence of PDGF by pyrene excimer formation. (C) Aptamer beacon for K+ detection by labeling with two fluorophores, F=FAM and T=TMARA.
Figure 22
Figure 22
An aptamer beacon with the aptamer being split into two fragments for HIV Tat protein detection (A) or for cocaine or ATP detection (B). Different designs of aptamer beacons based on the structure switching properties of aptamers (C), (D), and (E).
Figure 23
Figure 23
Aptamer-based detections involving PCR. (A) Detection of thrombin. The aptamer concentrations were very low and will not form priming interactions without both being associated to thrombin. (B) Detection of PDGF.
Figure 24
Figure 24
Fluorescence anisotropy-based aptamer sensors for detecting small molecule targets in a competitive assay format (A) or for detecting protein targets (B).
Figure 25
Figure 25
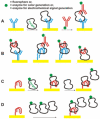
(A) A typical antibody-based ELISA assay. (B) Variations on ELISA involving aptamers. The primary binder on the surface (in blue) and the secondary binder (in red) can be either an antibody (shown as a Y shape, left panel) or an aptamer (shown as a curved shape, middle two panels). In the last panel, the target protein was directly immobilized onto the surface without being captured by antibodies or aptamers. Schematics of a displacement assay format (C) and a competitive assay format (D).
Figure 26
Figure 26
(A) A colorimetric cocaine sensor based on dye replacement. (B) Assembly of aptamer-functionalized AuNPs by proteins that can bind two aptamer molecules., (C) A colorimetric Hg2+ sensor and its color change in the presence of various metal ions (D). Reprinted with permission from Reference . Copyright 2007 John Wiley & Sons, Inc.
Figure 27
Figure 27
Colorimetric sensors based on the disassembly of AuNPs linked by an adenosine aptamer (A) or a cocaine aptamer (B). Specificity test of the adenosine (C) and cocaine (E) sensors. Insets: photographs of sensor solutions after treatment with analytes. Kinetics of sensor color change in the presence of varying concentrations of adenosine for the adenosine sensor (D), or cocaine for the cocaine sensor (F). Reprinted with permission from Reference . Copyright 2006 John Wiley & Sons, Inc.
Figure 28
Figure 28
Colorimetric sensors that change color only when both adenosine and cocaine are present (A) or either analyte is present (C). Kinetics ((B) and (D)) of color change of the aggregates in the presence of 1 mM adenosine, 1 mM cocaine, 0.5 mM adenosine and 0.5 mM cocaine, or no analytes in (A) and (C), respectively. Insets show the colors displayed by the sensors. Reprinted with permission from Reference . Copyright 2006 John Wiley & Sons, Inc.
Figure 29
Figure 29
(A) QD-encoded and aptamer-linked nanoparticles for multiplex detection. QD emission was initially quenched. Addition of target analytes allowed recovery of QD emission. (B-E) Luminescence spectra of mixed sensors in the presence of different analytes. Reprinted with permission from Reference . Copyright 2007 American Chemical Society.
Figure 30
Figure 30
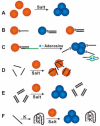
Colorimetric sensors based on non-crosslinking DNA. (A) Schematics of AuNP aggregation induced by electrolytes. (B) Different stabilities of AuNPs with different DNA in high salt buffers. (C) Colorimetric detection of adenosine. There are ∼100 DNA on each AuNP, but only one is shown for clarity. Non-thiol modified single-stranded DNA can also protect AuNPs from aggregation (D), but not double-stranded DNA (E). (F) Colorimetric detection of K+.
Figure 31
Figure 31
Aptamer/AuNP-based lateral flow device. (A) Left: adenosine-induced disassembly of AuNPs. Biotin is denoted as a black star. Right: schematics of lateral flow devices loaded with assembled nanoparticles (on the conjugation pad) and streptavidin (on the membrane in cyan) before use (left strip), in a negative (middle strip), or a positive (right strip) test. (B) Test of the adenosine device with varying concentrations of nucleosides. A = adenosine, C = cytidine, U = uridine. (C) Test of the cocaine device with varying concentrations of cocaine in undiluted human blood serum. Coc = cocaine, Ade = adenosine. Reprinted with permission from Reference . Copyright 2006 John Wiley & Sons, Inc.
Figure 32
Figure 32
(A) Sandwich assays for electrochemical thrombin detection. (B) Competitive assays based on electrochemical aptamer sensors.
Figure 33
Figure 33
Electrochemical impedance-based detection. (A) Protein detection based on electrode surface blocking upon protein binding. (B) Relief of surface blocking upon adenosine binding. (C) A displacement assay used to relieve blocking from aptamers for neomycin detection.
Figure 34
Figure 34
Electrochemical aptamer sensors based on aptamer structure change upon target binding. (A) Binding of thrombin moved the redox label away from the electrode surface. (B) Binding of cocaine pulled the label closer to the surface. The same design also worked for PDGF detection. (C) The label was in a DNA strand that formed two duplex regions with an aptamer. Addition of the target switched the aptamer structure and released the redox label to enhance electron transfer. (D) Binding of the target forced the label to be away from the electrode surface and decreased electron transfer.
Figure 35
Figure 35
Thrombin and lysozyme were labeled with CdS and PbS QDs, respectively. The labeled proteins were captured by immobilized aptamers for displacement assays. In the presence of unlabeled free target proteins, the labeled proteins were displaced. After dissolving the QDs, the metal species were detected by electrochemical stripping.
Figure 36
Figure 36
IgE aptamers labeled with an amine group (A), or a biotin (B) for surface attachment. (C) IgE aptamer with an extended stem.
Figure 37
Figure 37
A scheme of an aptamer sensor based on the change in surface acoustic waves. The aptamer is shown in green, which is attached to the gold surface via a DNA spacer (in black).
Figure 38
Figure 38
Allosteric aptamers. (A) A nucleic acid contains two aptamer regions and binding of one aptamer weakens the binding of the other. (B) The structure switching aptamer beacon can also be considered an allosteric aptamer., (C) An allosteric aptamer with a hairpin structure for nucleic acid detection. (D) Binding of one aptamer strengthens the binding of the other. Allosteric aptamers with adenosine-induced weakening (E) or enhancement (F) of thrombin binding. (G) Schematic of a riboswitch that shows metabolite-dependent mRNA translational control.,
Figure 39
Figure 39
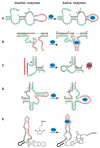
(A-C) Examples of NAEs with replaceable hairpins (in blue) in the enzyme strand. (D-H) Examples of aptazymes based on appending aptamers to Stem II of the hammerhead ribozyme. (I) An aptazyme activated by both theophyllilne and FMN with cooperativity. Optimization of aptazymes with in vitro selections by randomizing the communication module (J) or the aptamer (K). (L) A Hg2+-activated aptazyme based on a UO22+-specific DNAzyme.
Figure 40
Figure 40
Aptazymes based on antisense blocking of the substrate binding regions. (A) A Rev-dependent aptazyme based on the hammerhead ribozyme. (B) An ATP-dependent aptazyme based on the 8-17 DNAzyme.
Figure 41
Figure 41
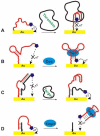
Other methods used to modulate NAE structures to design aptazymes. (A) An aptazyme based on a bridging aptamer to connect the substrate and enzyme. (B) Aptazymes based on inserting aptamers into substrate binding arms. (C) Aptamers as antisense DNAs to block enzyme active sites. Design of internal antisense interactions to obtain aptazymes based on an RNA-cleaving DNAzyme (D) and a Diels-Alderase (E).
Figure 42
Figure 42
DNA/RNAzymes activated by oligonucleotides. (A) Activation of the 8-17 DNAzyme; (B) the hairpin RNAzyme; and (C) the hammerhead RNAzyme. The cleavage sites are indicated by black arrows. (D) Activation of a ligase ribozyme. The position of ligation is indicated by the arrow. The oligonucleotide effectors for activation are drawn in red.
Figure 43
Figure 43
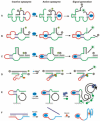
Signaling methods for designing fluorescent aptazyme sensors. Fluorophore and quencher flanking the cleavage site (A); on the ends of the substrate (B); brought close by extended enzyme strands as a template (C); or in a dual quencher format (D). (E) Signal generation from a surface immobilized aptazyme through rolling circle amplification and templated fluorophore immobilization. (F) An aptazyme with peroxidase activity.
Figure 44
Figure 44
Colorimetric aptazyme sensors for adenosine based on RNA-cleaving enzymes (A) and DNA ligation enzymes (B). Reprinted with permission from Reference . Copyright 2004 American Chemical Society.
Figure 45
Figure 45
QCM-based aptazyme sensors with a ligation aptazyme for the HIV-1 Rev peptide (A) or an RNA-cleaving aptazyme for theophylline (B).

References

    1. Tsien RY. In: Fluorescenct Chemosensors for Ion and Molecule Recognization. 538 ed. Czarnik AW, editor. American Chemical Society; Washington, DC: 1993.
    1. Czarnik AW. Chem. Biol. 1995;2:423. - PubMed
    1. Iqbal SS, Mayo MW, Bruno JG, Bronk BV, Batt CA, Chambers JP. Biosens. Bioelectron. 2000;15:549. - PubMed
    1. Ligler FS, Rowe Taitt CA, editors. Optical Biosensors:Present and Future. Elsevier Science B.V; Amsterdam: 2002.
    1. Robertson DL, Joyce GF. Nature. 1990;344:467. - PubMed

Publication types