. 2009 Mar;29(6):1083-95.
doi: 10.1111/j.1460-9568.2009.06660.x.

Secreted TARSH regulates olfactory mitral cell dendritic complexity

Affiliations

Secreted TARSH regulates olfactory mitral cell dendritic complexity

Ting-Wen Cheng et al. Eur J Neurosci. 2009 Mar.

Abstract

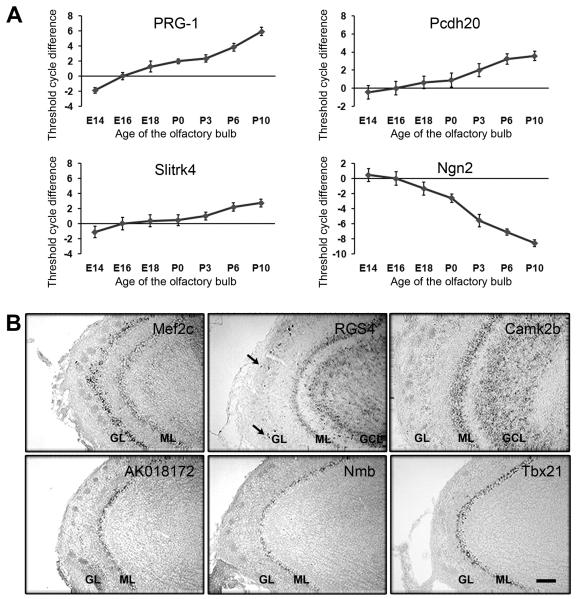
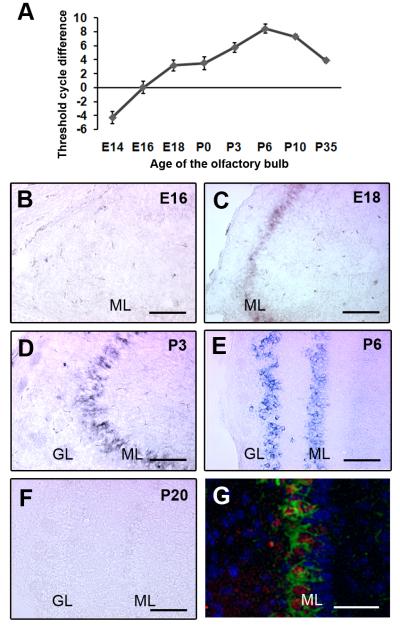
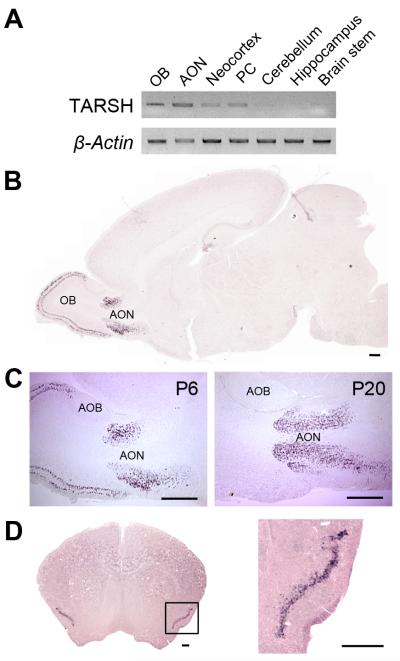
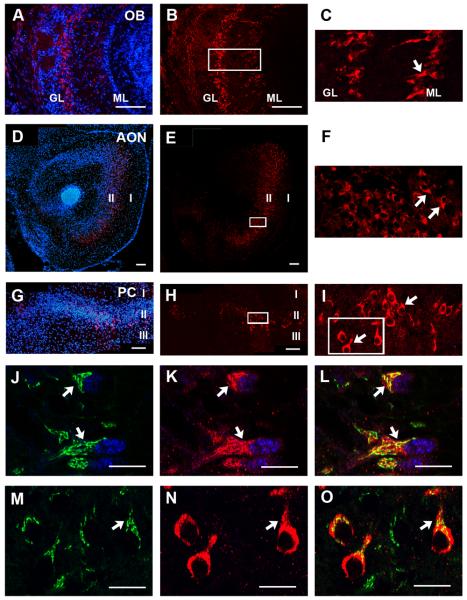
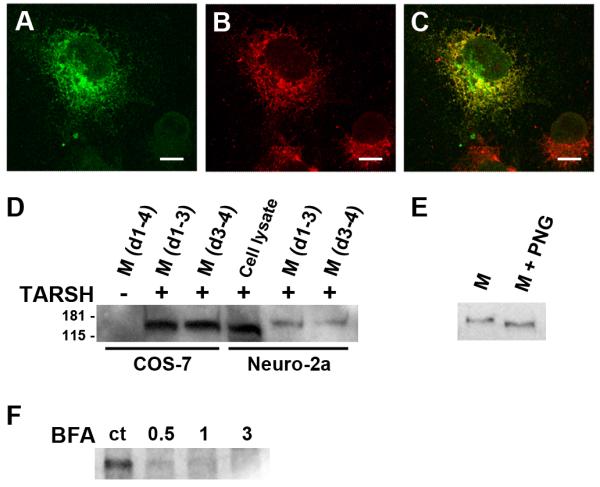
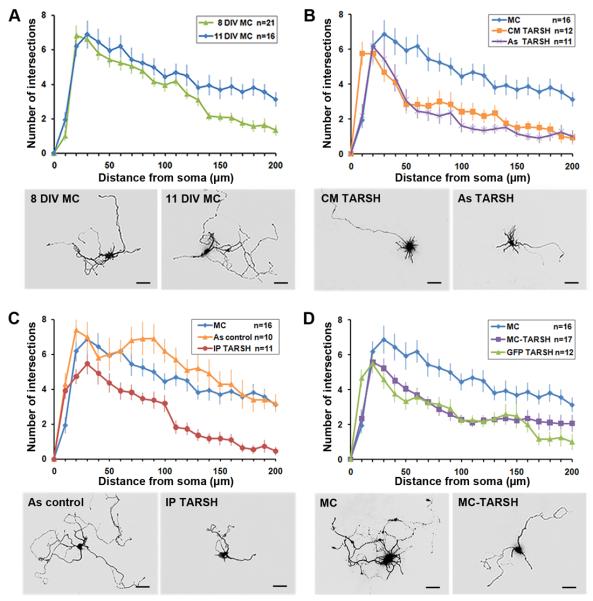
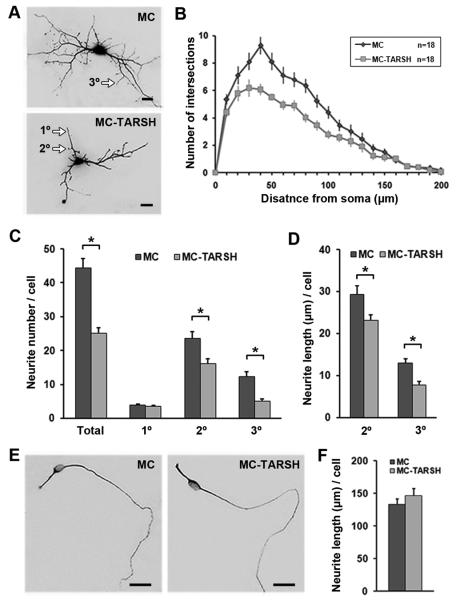
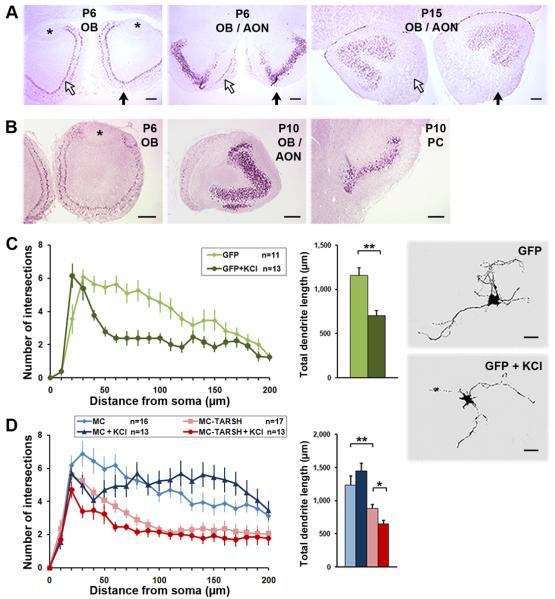
Olfactory sensory neurons synapse with mitral cells to form stereotyped connections in the olfactory bulb (OB). Mitral cell apical dendrites receive input from olfactory sensory neurons expressing the same odorant receptor. During development, this restricted dendritic targeting of mitral cells is achieved through eliminating elaborated dendritic trees to a single apical dendrite. Through a genome-wide microarray screen, we identified TARSH (Target of NESH SH3) as a transiently expressed molecule in mitral cells during the dendritic refinement period. TARSH expression is restricted to pyramidal neurons along the main olfactory pathway, including the anterior olfactory nucleus and piriform cortex. The dynamic TARSH expression is not altered when odor-evoked activity is blocked by naris closure or in AC3 knockout mice. We also demonstrate that TARSH is a secreted protein. In dissociated OB cultures, secreted TARSH promotes the reduction of mitral cell dendritic complexity and restricts dendritic branching and outgrowth of interneurons. Dendritic morphological changes were also observed in mitral cells overexpressing TARSH themselves. We propose that TARSH is part of the genetic program that regulates mitral cell dendritic refinement.


Figures

Figure 1
Figure 1. Dynamic and cell type specific gene expression in the developing OB
(A) Transcription dynamics of candidate genes in developing OB. Differentially expressed genes were identified by microarray experiments comparing E16 and P6 OBs transcription profiles. Transcription levels of selected genes were examined by quantitative RT-PCR and normalized to β-actin levels at different developmental time points (E14-P10). Continuously increased transcription trend was observed with upregulated candidate genes, such as PRG-1, Pcdh20, and Slitrk4. Downregulated candidate genes, Ngn2, showed continuously decrease of transcription level. (B) Expression patterns of upregulated candidate genes on sagittal sections of P6 OB. Rostral tips of the OB were pointing to the left. In situ hybridization was used to examine transcript distribution and identify cell-type specific gene in P6 OB. Postnatally upregulated canidate genes, such as Mef2c, RGS4, and Camk2b were expressed in multiple types of neurons, including mitral cells (ML), tufted cells, granule cells (GCL), periglomerular cells (arrows). Candidate genes, AK018172, Nmb, and Tbx21, were specifically expressed in mitral cells but not other neuronal types in P6 OB. GL, glomerular layer. Scale bars, 100 μm.
Figure 2
Figure 2. Transient TARSH expression in mitral and tufted cells of the olfactory bulb
(A) The transcription level of TARSH was examined by quantitative RT-PCR using mRNA from E14-P35 OB. TARSH transcripts continuously increased from E14, peaked around P6, and decreased after P10. (B-F) In situ localization of TARSH transcripts in the developing OB. TARSH signals were first detected in the mitral/tufted cell layer (ML) at E18 (C). TARSH expression was restricted in mitral (ML) and tufted cell layers at P3 (D) and P6 (E). At P20, TARSH expression was not observed in the OB (F). (G) Fluorescent in situ localization of TARSH transcripts (green) in the same cell population stained with mitral cell antibody marker Tbx21 (red) in the P6 OB. Blue, DAPI. GL, glomerular layer. Scale bars: (B-F), 100 μm; (G), 25 μm.
Figure 3
Figure 3. TARSH transcript expression in cortical regions of the main olfactory pathway
(A) RT-PCR of TARSH transcripts in P6 brain tissues. TARSH transcripts were detected in regions of the olfactory pathway, namely olfactory bulb (OB), anterior olfactory nucleus (AON), and piriform cortex (PC). TARSH expression was low in the neocortex and not detected in other regions of the brain. β-Actin served as the loading control. (B) In situ hybridization with a TARSH antisense probe on a P6 whole brain section. TARSH signals were detected in the OB and AON, but not other brain regions. (C) TARSH expression in the developing OB and AON. At P6, TARSH was detected in mitral and tufted cell layers within the main OB and layer II neurons in the AON. At P20, TARSH expression in the AON remained while the expression in the OB diminished. TARSH hybridization signal was not detected in the accessory olfactory bulb (AOB). (D) TARSH expression in the PC. TARSH in situ hybridization signals were detected in layer II neurons of the PC at P20. An enlarged view of the region indicated with the square is shown on the right. Scale bars, 500 μm.
Figure 4
Figure 4. TARSH protein expression pattern in the olfactory pathway
Immunohistochemical localization of TARSH in brain regions of the main olfactory pathway at P6. (A-C) In the OB, TARSH signals (red) were detected in the mitral cell layer (ML) and tufted cells next to the glomerular layer (GL), shown by DAPI counterstaining (blue). (D-F) In the AON, TARSH (red) was detected in layer II neurons (DAPI, blue). (G-I) In the PC, TARSH (red) was also detected in layer II neurons (DAPI, blue). Higher magnification confocal images of the equivalent square regions indicated in (B, E, H) were shown in (C, F, I). TARSH was expressed by pyramidal shaped neurons (arrows) in OB (C), AON (F) and PC (I). (J-L) By confocal imaging, TARSH (red) immunostaining partially overlap with GM130 (green), a cis-Golgi compartment marker which is enriched at the base of mitral cell apical dendrites (arrows). Mitral cells were identified by Tbx21 expression (blue). (M-O) Higher magnification confocal images of the square region indicate in (I). TARSH (red) subcellular distribution was perinuclear and at the base of apical dendrites (arrow) in PC neurons. GM130 (green) immunoreactivity partially overlaps with TARSH expression. Scale bars: (A-H), 100 μm; (J-O), 50 μm.
Figure 5
Figure 5. TARSH is a secreted protein
(A-C) TARSH distribution in COS-7 cells. Ectopically expressed TARSH-GFP (green) overlaps with the ER network marker PDI (red). TARSH was distributed in the ER secretory pathway. (D) Detection of TARSH in the media by Western blotting. TARSH-Myc expression construct was introduced into COS-7 and Neuro-2a cells by lentivirus. TARSH was detected in the culture medium (M) of both COS-7 and Neuro-2a cells 3 days after infection (d1-3). TARSH was also detected at day 4 after replacing culture medium at day 3(d3-4) suggesting that the release of TARSH was not from lysed cells. (E) Deglycosyaltion of TARSH protein. When the medium was treated with N-glycosidase (PNG), the molecular weight of TARSH reduced. (F) Blockage of TARSH secretion. When cells were treated with secretion inhibitor brefeldin A (BFA) at indicated concentrations (μg/ml), the release of TARSH into the medium was blocked. Scale bars, 10 μm.
Figure 6
Figure 6. TARSH induces the reduction of dendritic complexity in mitral cells
Sholl analysis of mitral cell dendritic complexity in dissociated OB cultures. (A) Between 8 DIV and 11 DIV, the dendrite complexity of mitral cell transfected with control RFP plasmids (MC) did not change within 130 μm radial distance from the soma (P > 0.10). Treatments in (B-D) were applied to the cultures at 8 DIV and mitral cell dendritic complexity were evaluated at 11 DIV. (B) TARSH conditioned medium (CM TARSH) treatment induced significant reduction of mitral cell dendritic complexity compared to the control (MC) (>30 μm from the soma; P < 0.05). Similar effect was also observed when cultured mitral cells were transferred to an astrocyte feeder layer transfected with TARSH expression plasmids (As TARSH) (>50 μm from the soma, P < 0.01). (C) Purified TARSH protein (IP TARSH) induced significant reduction of mitral cell dendritic complexity compared to the control (MC) (>50 μm from the soma; P < 0.01). Astrocyes pre-exposed to purified TARSH protein (As control) did not alter mitral cell dendritic complexity. (D) Mitral cells overexpressing TARSH (MC-TARSH) showed significant reduction of dendritic complexity compared to the control (MC) (>30 μm from the soma; P < 0.05). Similar dendritic complexity reduction effect were also observed in non-transfected mitral cells visualized by GFP expression (GFP TARSH) (>30 μm from the soma; P < 0.05) when other cells in the same culture were overexpressing TARSH. Scale bars, 50 μm. t-test was used for all statistics. Values are mean ± s.e.m.
Figure 7
Figure 7. TARSH restricts neurite outgrowth of OB interneurons but not olfactory sensory neurons
(A) Morphology of OB interneurons. Astrocyte feeder layers were transfected with RFP plasmid (MC) or the TARSH expression construct (MC-TARSH). Interneurons were transfected with GFP plasmids to visualize their morphology. The neurite complexities of the interneurons decreased significantly at a distance of 40–120 μm away from the soma when TARSH is present in the media (t-test, P-value < 0.04) (B). With astrocyte expressing TARSH, total neurite branch number reduced 43% (MC n=21; MC-TARSH n=30) (C). Fewer secondary and tertiary branches were observed, while primary branch number did not change (C). The neurite lengths of secondary and tertiary branches were also shorter in the presence of TARSH (D). (E) Morphology of olfactory sensory neurons. Cell morphology was visualized by β-tubulin staining. A bipolar morphology of the olfactory sensory neuron was observed in the presence of MC-TARSH expressing astrocytes. (F) The axonal-like neurite length of olfactory sensory neurons was not affected by the presence of TARSH (MC n=58; MC-TARSH n=43). Scale bars, 20 μm. *, t-test, P-value < 0.01. Values are mean ± s.e.m.
Figure 8
Figure 8. TARSH expression and function are independent of neuronal activity
(A) In situ hybridization of TARSH in unilateral naris closure mice. No difference in Opg in situ signals were observed in the OB and AON at P6 and P15 between ipsilateral (solid arrows) or contralateral (open arrows) sides of the naris closure. The transient expression time window of Opg in the mitral/tufted cell and AON was not affected by odor deprivation. *, AOB. Scale bars, 200 μm. (B) TARSH expression in the OB, AON, and PC was not altered in AC3 knock-out mice. (C) Mitral cell morphology after KCl treatment. Mitral cell morphology was visualized by transfecting with GFP expression plasmids. Mitral cells were treated with 25mM KCl for 24 hour before being fixed at 8 DIV. Dendritic complexity and total dendrite length (within 200 μm radial distance) were reduced significantly when treated with KCl. (D) Mitral cell morphology was influenced by TARSH and neuronal activity. Mitral cell morphology was visualized by MCherry expression (MC). Overexpressing TARSH (MC-TARSH) in the mitral cell reduced dendritic complexity and decreased dendrite length by 30%. More severe reduction of dendritic complexity and dendrite length were observed when MC-TARSH mitral cells were treated with KCl at threshold duration (8 hour) before being fixed at 11 DIV. Scale bars, 50 μm. t-test, *p-value =0.04; **p-value ≤ 0.01. Values are mean ± s.e.m.

Similar articles

Cited by

References

    1. Bagri A, Cheng HJ, Yaron A, Pleasure SJ, Tessier-Lavigne M. Stereotyped pruning of long hippocampal axon branches triggered by retraction inducers of the semaphorin family. Cell. 2003;113:285–299. - PubMed
    1. Bjartmar L, Huberman AD, Ullian EM, Renteria RC, Liu X, Xu W, Prezioso J, Susman MW, Stellwagen D, Stokes CC, Cho R, Worley P, Malenka RC, Ball S, Peachey NS, Copenhagen D, Chapman B, Nakamoto M, Barres BA, Perin MS. Neuronal pentraxins mediate synaptic refinement in the developing visual system. J Neurosci. 2006;26:6269–6281. - PMC - PubMed
    1. Blanchart A, De Carlos JA, Lopez-Mascaraque L. Time frame of mitral cell development in the mice olfactory bulb. J Comp Neurol. 2006;496:529–543. - PubMed
    1. Brennan PA. The vomeronasal system. Cell Mol Life Sci. 2001;58:546–555. - PMC - PubMed
    1. Chen H, Kohno K, Gong Q. Conditional ablation of mature olfactory sensory neurons mediated by diphtheria toxin receptor. J Neurocytol. 2005;34:37–47. - PubMed

Publication types

MeSH terms