Sugarcane genes associated with sucrose content
- PMID: 19302712
- PMCID: PMC2666766
- DOI: 10.1186/1471-2164-10-120
Sugarcane genes associated with sucrose content
Abstract
Background: Sucrose content is a highly desirable trait in sugarcane as the worldwide demand for cost-effective biofuels surges. Sugarcane cultivars differ in their capacity to accumulate sucrose and breeding programs routinely perform crosses to identify genotypes able to produce more sucrose. Sucrose content in the mature internodes reach around 20% of the culms dry weight. Genotypes in the populations reflect their genetic program and may display contrasting growth, development, and physiology, all of which affect carbohydrate metabolism. Few studies have profiled gene expression related to sugarcane's sugar content. The identification of signal transduction components and transcription factors that might regulate sugar accumulation is highly desirable if we are to improve this characteristic of sugarcane plants.
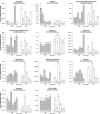
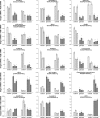
Results: We have evaluated thirty genotypes that have different Brix (sugar) levels and identified genes differentially expressed in internodes using cDNA microarrays. These genes were compared to existing gene expression data for sugarcane plants subjected to diverse stress and hormone treatments. The comparisons revealed a strong overlap between the drought and sucrose-content datasets and a limited overlap with ABA signaling. Genes associated with sucrose content were extensively validated by qRT-PCR, which highlighted several protein kinases and transcription factors that are likely to be regulators of sucrose accumulation. The data also indicate that aquaporins, as well as lignin biosynthesis and cell wall metabolism genes, are strongly related to sucrose accumulation. Moreover, sucrose-associated genes were shown to be directly responsive to short term sucrose stimuli, confirming their role in sugar-related pathways.
Conclusion: Gene expression analysis of sugarcane populations contrasting for sucrose content indicated a possible overlap with drought and cell wall metabolism processes and suggested signaling and transcriptional regulators to be used as molecular markers in breeding programs. Transgenic research is necessary to further clarify the role of the genes and define targets useful for sugarcane improvement programs based on transgenic plants.
Figures


Similar articles
-
Signal transduction-related responses to phytohormones and environmental challenges in sugarcane.BMC Genomics. 2007 Mar 13;8:71. doi: 10.1186/1471-2164-8-71. BMC Genomics. 2007. PMID: 17355627 Free PMC article.
-
Identification of drought-response genes and a study of their expression during sucrose accumulation and water deficit in sugarcane culms.BMC Plant Biol. 2011 Jan 13;11:12. doi: 10.1186/1471-2229-11-12. BMC Plant Biol. 2011. PMID: 21226964 Free PMC article.
-
Ethylene-mediated improvement in sucrose accumulation in ripening sugarcane involves increased sink strength.BMC Plant Biol. 2019 Jun 28;19(1):285. doi: 10.1186/s12870-019-1882-z. BMC Plant Biol. 2019. PMID: 31253103 Free PMC article.
-
Sugarcane for bioenergy production: an assessment of yield and regulation of sucrose content.Plant Biotechnol J. 2010 Apr;8(3):263-76. doi: 10.1111/j.1467-7652.2009.00491.x. Plant Biotechnol J. 2010. PMID: 20388126 Review.
-
RNAi and genome editing of sugarcane: Progress and prospects.Plant J. 2025 Mar;121(5):e70048. doi: 10.1111/tpj.70048. Plant J. 2025. PMID: 40051334 Free PMC article. Review.
Cited by
-
A short review on sugarcane: its domestication, molecular manipulations and future perspectives.Genet Resour Crop Evol. 2022;69(8):2623-2643. doi: 10.1007/s10722-022-01430-6. Epub 2022 Sep 16. Genet Resour Crop Evol. 2022. PMID: 36159774 Free PMC article. Review.
-
The evolutionary history of calreticulin and calnexin genes in green plants.Genetica. 2011 Feb;139(2):255-9. doi: 10.1007/s10709-010-9544-y. Epub 2011 Jan 11. Genetica. 2011. PMID: 21222018
-
The FBH family of bHLH transcription factors controls ACC synthase expression in sugarcane.J Exp Bot. 2018 Apr 27;69(10):2511-2525. doi: 10.1093/jxb/ery083. J Exp Bot. 2018. PMID: 29514290 Free PMC article.
-
Natural Variation of Lignocellulosic Components in Miscanthus Biomass in China.Front Chem. 2020 Nov 5;8:595143. doi: 10.3389/fchem.2020.595143. eCollection 2020. Front Chem. 2020. PMID: 33251186 Free PMC article.
-
Oligomerization, membrane association, and in vivo phosphorylation of sugarcane UDP-glucose pyrophosphorylase.J Biol Chem. 2014 Nov 28;289(48):33364-77. doi: 10.1074/jbc.M114.590125. Epub 2014 Oct 15. J Biol Chem. 2014. PMID: 25320091 Free PMC article.
References
-
- Daniels J, Roach BT. Taxonomy and evolution in sugarcane. In: Heinz D, editor. Sugarcane improvement through breeding. Amsterdam: Elsevier Press; 1987. pp. 7–84.
-
- Daniels J, Daniels C. Geographical, historical and cultural aspect of the origin of the Indian and Chinese sugarcanes S. barberi and S. sinense. Sugarcane Breeding newsletter. 1975;36:4–23.
-
- Roach BT. Nobilisation of sugarcane. Proc Int Soc Sugar Cane Technol. 1972;14:206–216.
-
- Arceneaux G. Cultivated sugarcanes of the world and their botanical derivation. Proc Int Soc Sugar Cane Technol. 1967;12:844–854.
-
- Price S. Interspecific hybridization in sugarcane breeding. Proc Int Soc Sugar Cane Technol. 1965;12:1021–1026.
Publication types
MeSH terms
Substances
LinkOut - more resources
Full Text Sources
Molecular Biology Databases

