

Apoptotic signaling induced by H2O2-mediated oxidative stress in differentiated C2C12 myotubes
- PMID: 19302811
- PMCID: PMC2778208
- DOI: 10.1016/j.lfs.2009.01.014
Apoptotic signaling induced by H2O2-mediated oxidative stress in differentiated C2C12 myotubes
Abstract
Aims: Apoptotic signaling proteins were evaluated in postmitotic skeletal myotubes to test the hypothesis that oxidative stress induced by H(2)O(2) activates both caspase-dependent and caspase-independent apoptotic proteins in differentiated C2C12 myotubes. We hypothesized that oxidative stress would decrease anti-apoptotic protein levels in C2C12 myotubes.
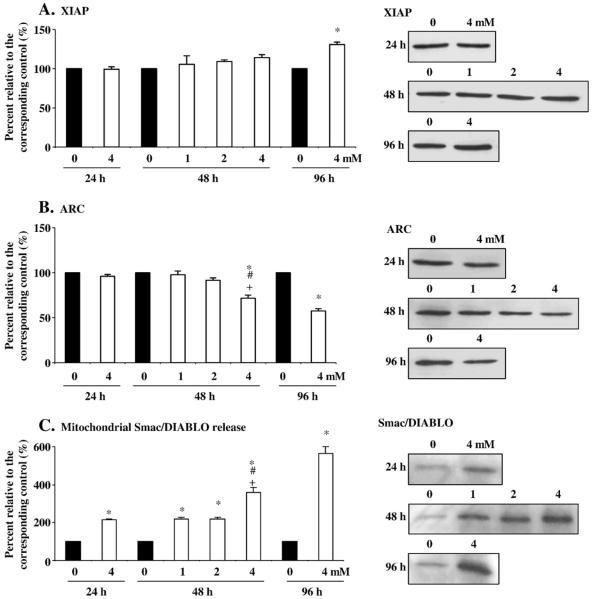
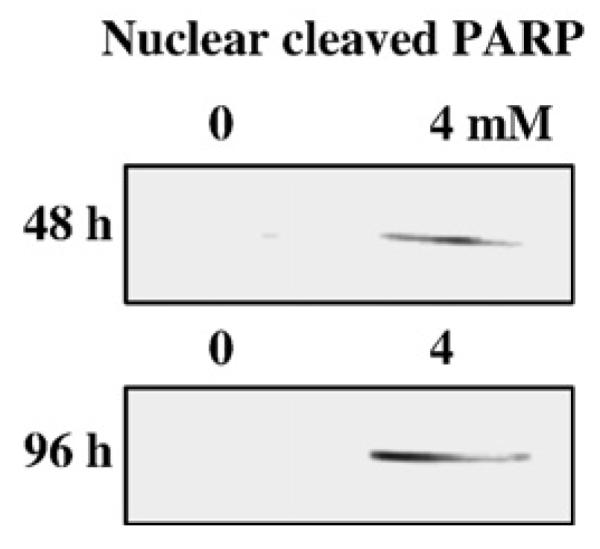
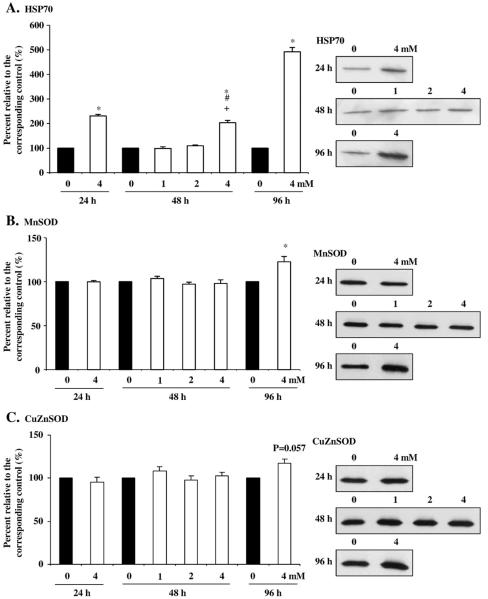
Main methods: Apoptotic regulatory factors and apoptosis-associated proteins including Bcl-2, Bax, Apaf-1, XIAP, ARC, cleaved PARP, p53, p21(Cip1/Waf1), c-Myc, HSP70, CuZnSOD, and MnSOD protein content were measured by immunoblots.
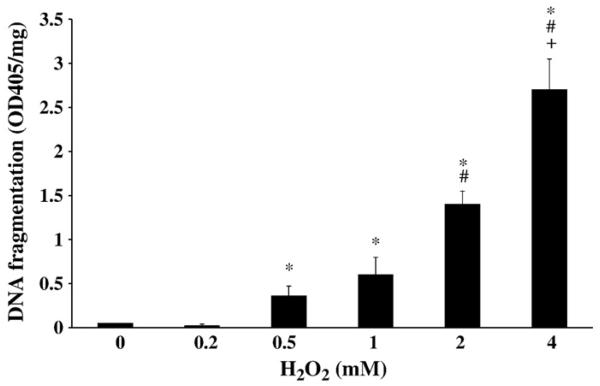
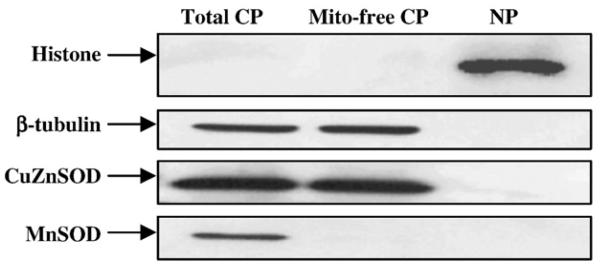
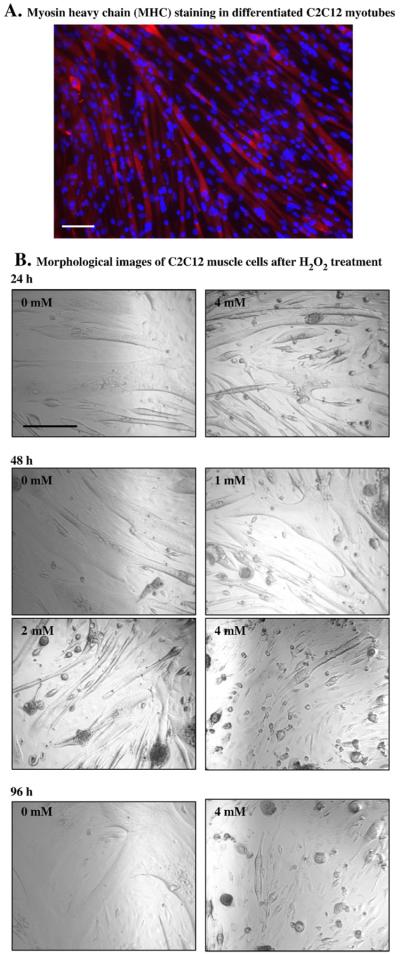
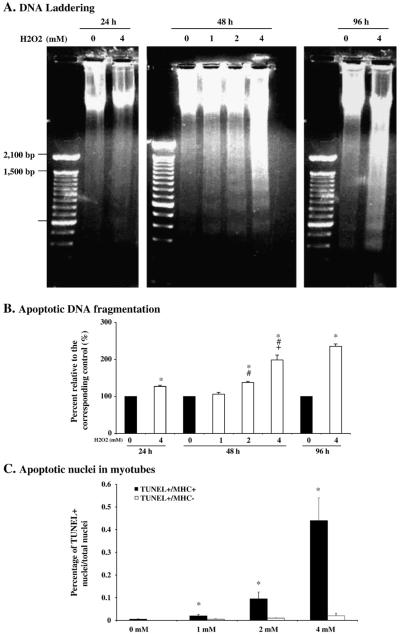
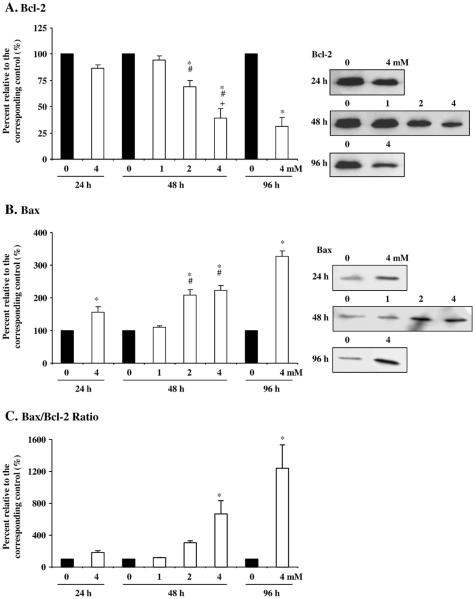
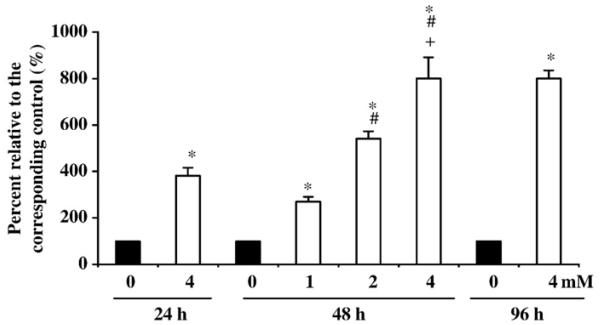
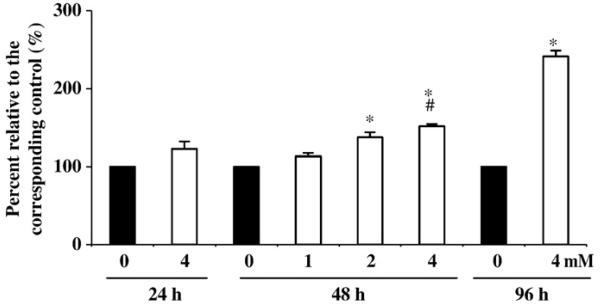
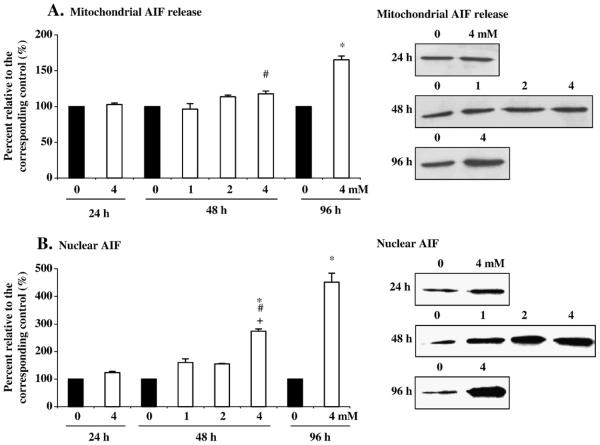
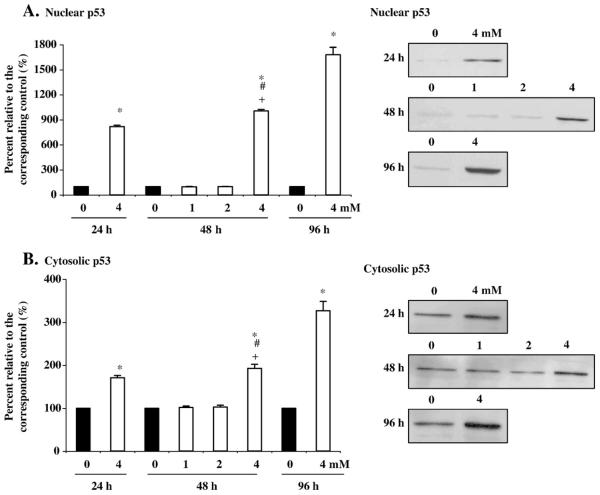
Key findings: H(2)O(2) induced apoptosis in myotubes as shown by DNA laddering and an elevation of apoptotic DNA fragmentation. Cell death ELISA showed increase in the extent of apoptotic DNA fragmentation following treatment with H(2)O(2). Treatment with 4 mM of H(2)O(2) for 24 or 96 h caused increase in Bax (56%, 227%), cytochrome c (282%, 701%), Smac/DIABLO (155%, 260%), caspase-3 protease activity (51%, 141%), and nuclear and cytosolic p53 (719%, 1581%) levels in the myotubes. As an estimate of the mitochondrial AIF release to the cytosol, AIF protein content measured in the mitochondria-free cytosolic fraction was elevated by 65% after 96 h treatment with 4 mM of H(2)O(2). AIF measured in the nuclear protein fraction increased by 74% and 352% following treatment with 4 mM of H(2)O(2) for 24 and 96 h, respectively. Bcl-2 declined in myotubes by 61% and 69% after 24 or 96 h of treatment in 4 mM H(2)O(2), respectively.
Significance: These findings indicate that both caspase-dependent and caspase-independent mechanisms are involved in coordinating the activation of apoptosis induced by H(2)O(2) in differentiated myotubes.
Figures
Similar articles
-
Apoptosis in differentiating C2C12 muscle cells selectively targets Bcl-2-deficient myotubes.Apoptosis. 2014 Jan;19(1):42-57. doi: 10.1007/s10495-013-0922-7. Apoptosis. 2014. PMID: 24129924 Free PMC article.
-
Cell death-resistance of differentiated myotubes is associated with enhanced anti-apoptotic mechanisms compared to myoblasts.Apoptosis. 2011 Mar;16(3):221-34. doi: 10.1007/s10495-010-0566-9. Apoptosis. 2011. PMID: 21161388 Free PMC article.
-
Dietary resveratrol confers apoptotic resistance to oxidative stress in myoblasts.J Nutr Biochem. 2017 Dec;50:103-115. doi: 10.1016/j.jnutbio.2017.08.008. Epub 2017 Aug 24. J Nutr Biochem. 2017. PMID: 29053994 Free PMC article.
-
Role of Smac/DIABLO in hydrogen peroxide-induced apoptosis in C2C12 myogenic cells.Free Radic Biol Med. 2005 Sep 1;39(5):658-67. doi: 10.1016/j.freeradbiomed.2005.04.018. Free Radic Biol Med. 2005. PMID: 16085184
-
The peculiar apoptotic behavior of skeletal muscle cells.Histol Histopathol. 2013 Aug;28(8):1073-87. doi: 10.14670/HH-28.1073. Epub 2013 Feb 12. Histol Histopathol. 2013. PMID: 23400589
Cited by
-
Monascus pigment prevent the oxidative cytotoxicity in myotube derived hydrogen peroxide.J Clin Biochem Nutr. 2024 Jul;75(1):33-39. doi: 10.3164/jcbn.22-62. Epub 2023 Sep 20. J Clin Biochem Nutr. 2024. PMID: 39070528 Free PMC article.
-
Oxidative Stress Alters the Morphological Responses of Myoblasts to Single-Site Membrane Photoporation.Cell Mol Bioeng. 2017 May 3;10(4):313-325. doi: 10.1007/s12195-017-0488-5. eCollection 2017 Aug. Cell Mol Bioeng. 2017. PMID: 31719866 Free PMC article.
-
Apoptosis in differentiating C2C12 muscle cells selectively targets Bcl-2-deficient myotubes.Apoptosis. 2014 Jan;19(1):42-57. doi: 10.1007/s10495-013-0922-7. Apoptosis. 2014. PMID: 24129924 Free PMC article.
-
Effect of mebudipine on oxidative stress and lipid peroxidation in myocardial ischemic-reperfusion injury in male rat.J Res Med Sci. 2012 Dec;17(12):1150-5. J Res Med Sci. 2012. PMID: 23853633 Free PMC article.
-
Protective Effect of Ergothioneine against Oxidative Stress-Induced Chondrocyte Death.Antioxidants (Basel). 2024 Jul 1;13(7):800. doi: 10.3390/antiox13070800. Antioxidants (Basel). 2024. PMID: 39061869 Free PMC article.
References
-
- Alway SE, Degens H, Krishnamurthy G, Smith CA. Potential role for Id myogenic repressors in apoptosis and attenuation of hypertrophy in muscles of aged rats. American Journal of Physiology. Cell Physiology. 2002;283(1):C66–C76. - PubMed
-
- Alway SE, Degens H, Krishnamurthy G, Chaudhrai Aa. Denervation stimulates apoptosis but not Id2 expression in hindlimb muscles of aged rats. Journals of Gerontology A, Biological Sciences and Medical Sciences. 2003;58(8):687–697. - PubMed
-
- Alway SE, Martyn JK, Ouyang J, Chaudhrai A, Murlasits ZSb. Id2 expression during apoptosis and satellite cell activation in unloaded and loaded quail skeletal muscles. American Journal of Physiology. Regulatory, Integrative, and Comparative Physiology. 2003;284(2):R540–R549. - PubMed
-
- Anderson KM, Seed T, Ou D, Harris JE. Free radicals and reactive oxygen species in programmed cell death. Medical Hypotheses. 1999;52(5):451–463. - PubMed
Publication types
MeSH terms
Substances
Grants and funding
LinkOut - more resources
Full Text Sources
Research Materials
Miscellaneous
