

The limitation of species range: a consequence of searching along resource gradients
- PMID: 19303032
- PMCID: PMC2760341
- DOI: 10.1016/j.tpb.2009.03.001
The limitation of species range: a consequence of searching along resource gradients
Abstract
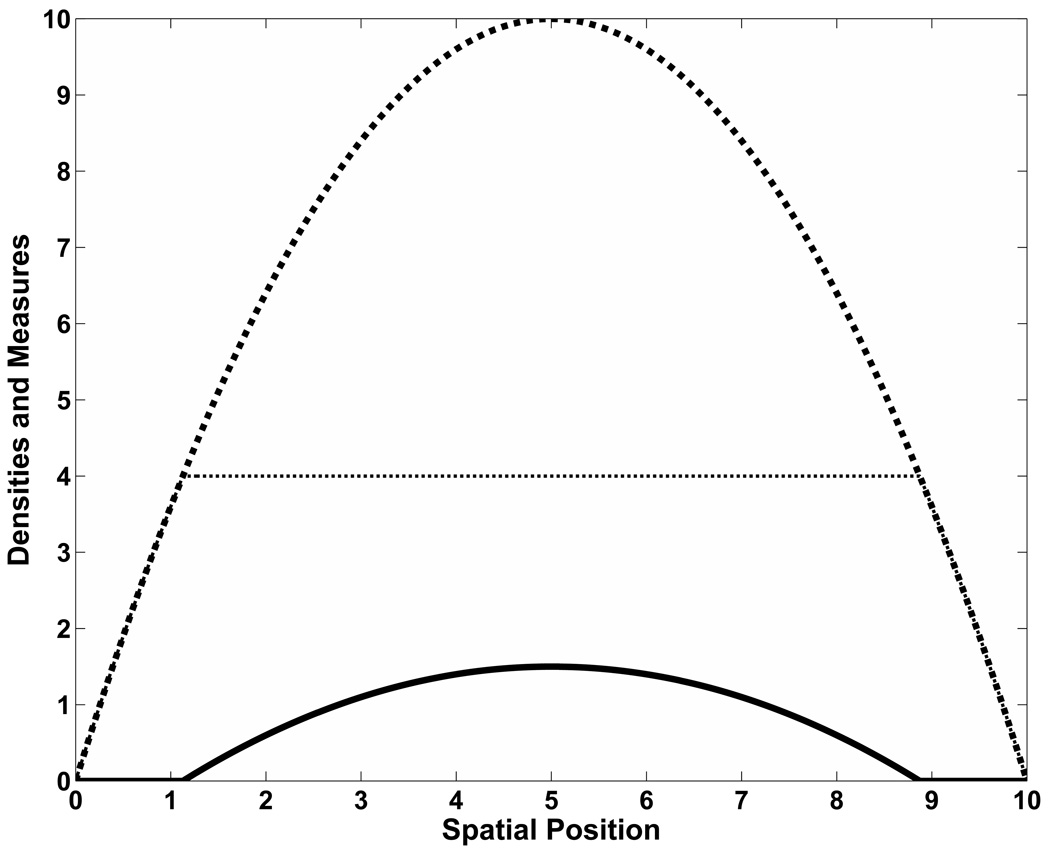
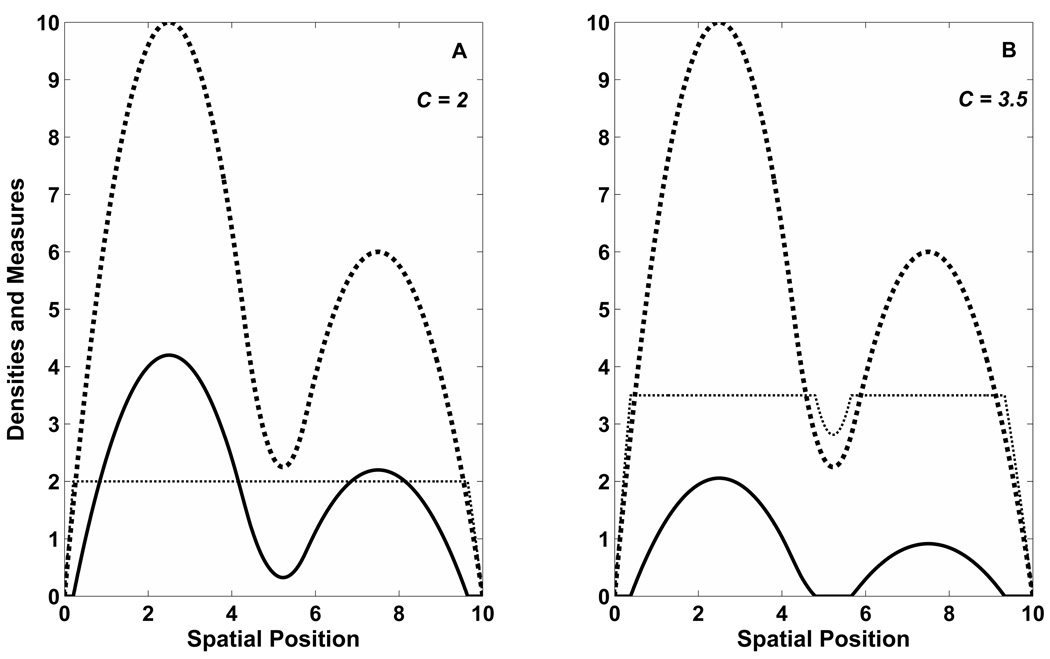
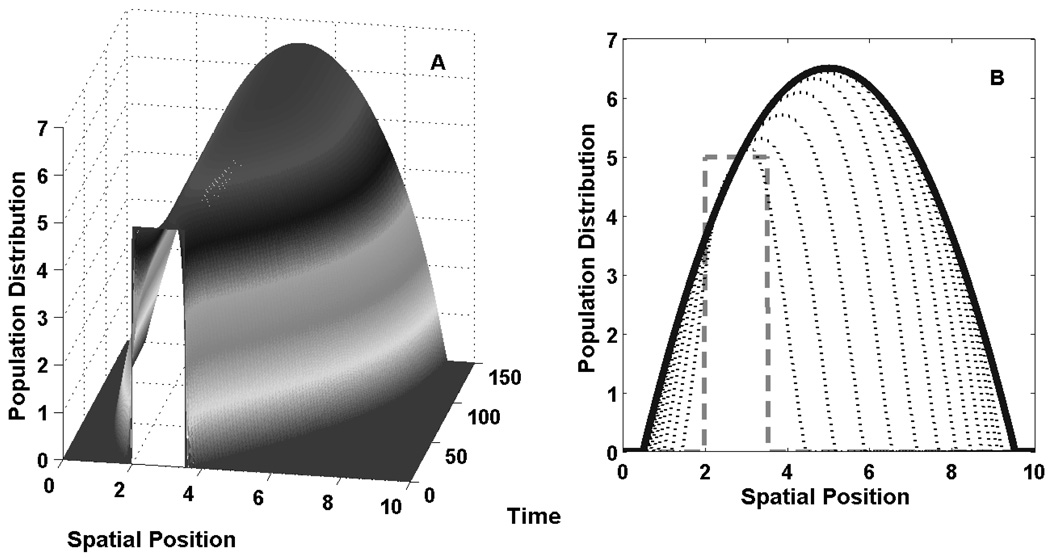
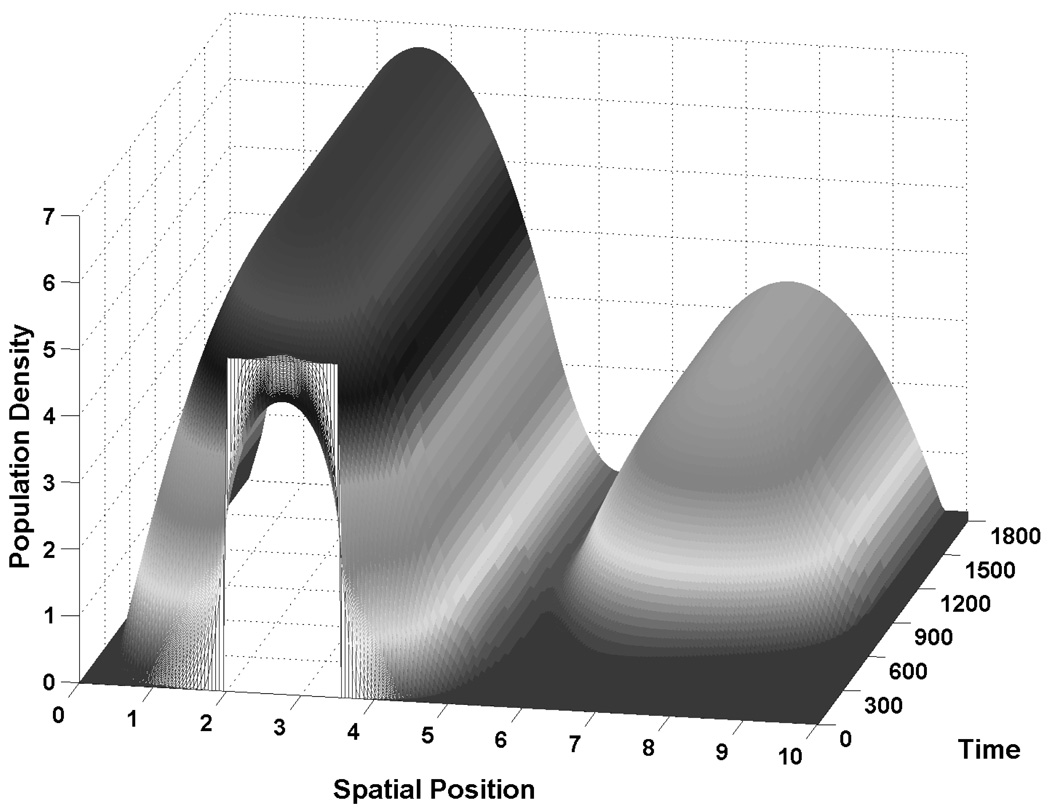
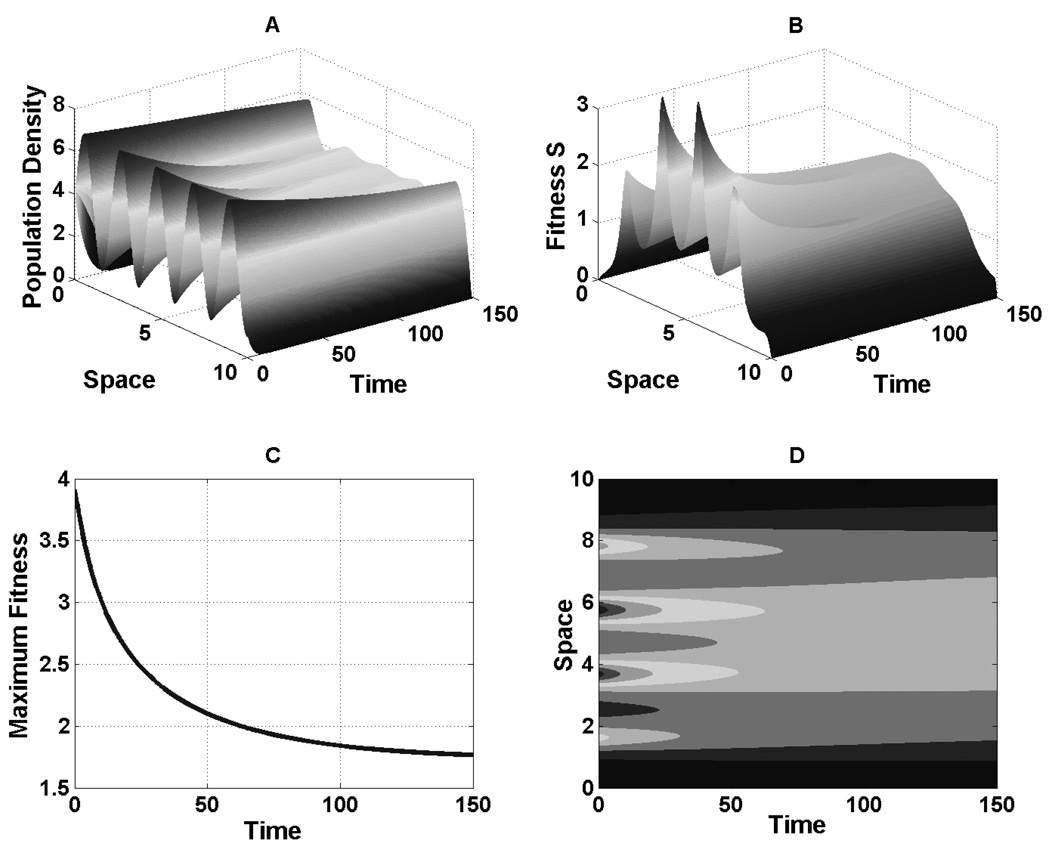
Ecological modelers have long puzzled over the spatial distribution of species. The random walk or diffusive approach to dispersal has yielded important results for biology and mathematics, yet it has been inadequate in explaining all phenomenological features. Ranges can terminate non-smoothly absent a complementary shift in the characteristics of the environment. Also unexplained is the absence of a species from nearby areas of adequate, or even abundant, resources. In this paper, I show how local searching behavior-keyed to a density-dependent fitness-can limit the speed and extent of a species' spread. In contrast to standard diffusive processes, pseudo-rational movement facilitates the clustering of populations. It also can be used to estimate the speed of an expanding population range, explain expansion stall, and provides a mechanism by which a population can colonize seemingly removed regions - biogeographic islands in a continental framework. Finally, I discuss the effect of resource degradation and different resource impact/utilization curves on the model.
Figures
Similar articles
-
Folic acid supplementation and malaria susceptibility and severity among people taking antifolate antimalarial drugs in endemic areas.Cochrane Database Syst Rev. 2022 Feb 1;2(2022):CD014217. doi: 10.1002/14651858.CD014217. Cochrane Database Syst Rev. 2022. PMID: 36321557 Free PMC article.
-
Conceptual synthesis in community ecology.Q Rev Biol. 2010 Jun;85(2):183-206. doi: 10.1086/652373. Q Rev Biol. 2010. PMID: 20565040 Review.
-
Dispersal, niche breadth and population extinction: colonization ratios predict range size in North American dragonflies.J Anim Ecol. 2014 Jul;83(4):858-65. doi: 10.1111/1365-2656.12181. Epub 2013 Dec 10. J Anim Ecol. 2014. PMID: 24237364
-
A graphical-mechanistic approach to spatial resource competition.Am Nat. 2015 Jan;185(1):E1-13. doi: 10.1086/679066. Epub 2014 Dec 2. Am Nat. 2015. PMID: 25560561
-
Evolving mutation rate advances the invasion speed of a sexual species.BMC Evol Biol. 2017 Jun 26;17(1):150. doi: 10.1186/s12862-017-0998-8. BMC Evol Biol. 2017. PMID: 28651517 Free PMC article.
Cited by
-
Using mathematical modelling to investigate the adaptive divergence of whitefish in Fennoscandia.Sci Rep. 2020 Apr 30;10(1):7394. doi: 10.1038/s41598-020-63684-3. Sci Rep. 2020. PMID: 32355195 Free PMC article.
-
Vocal communications and the maintenance of population specific songs in a contact zone.PLoS One. 2012;7(5):e35257. doi: 10.1371/journal.pone.0035257. Epub 2012 May 4. PLoS One. 2012. PMID: 22574116 Free PMC article.
-
Two-Species Migration and Clustering in Two-Dimensional Domains.Bull Math Biol. 2017 Oct;79(10):2302-2333. doi: 10.1007/s11538-017-0331-0. Epub 2017 Aug 18. Bull Math Biol. 2017. PMID: 28822041 Free PMC article.
-
A differential game theoretical analysis of mechanistic models for territoriality.J Math Biol. 2010 Nov;61(5):665-94. doi: 10.1007/s00285-009-0316-1. Epub 2009 Dec 22. J Math Biol. 2010. PMID: 20033174
-
A continuous ideal free distribution approach to the dynamics of selfish, cooperative and kleptoparasitic populations.R Soc Open Sci. 2016 Nov 30;3(11):160788. doi: 10.1098/rsos.160788. eCollection 2016 Nov. R Soc Open Sci. 2016. PMID: 28018667 Free PMC article.
References
-
- Andow DA, Kareiva PM, Levin SA, Okuba A. Spread of invading organisms. Landscape Eco. 1990;4(23):177–188.
-
- Armsworth PR, Roughgarden JE. The impact of directed versus random movement on population dynamics and biodiversity patterns. Am. Nat. 2005a;165(4):449–465. - PubMed
-
- Armsworth PR, Roughgarden JE. Disturbance induces the contrasting evolution of reinforcement and dispersiveness in directed and random movers. Evol. 2005b;59(10):2083–2096. - PubMed
-
- Arnoson DG. The porous medium equation. In: Fasano A, Promicerio M, editors. Nonlinear Diffusion Problems. Lecture Notes in Mathematics. Vol. 1224. New York: Springer; 1986. pp. 1–46.
-
- Beddington JR. Mutual interference between parasites or predators and its effect on searching effciency. J. Animal Ecol. 1975;44:331–340.
Publication types
MeSH terms
Grants and funding
LinkOut - more resources
Full Text Sources
