. 2009 Apr 17;30(4):599-609.
doi: 10.1016/j.immuni.2009.01.011. Epub 2009 Mar 19.

Initial clonal expansion of germinal center B cells takes place at the perimeter of follicles

Affiliations

Initial clonal expansion of germinal center B cells takes place at the perimeter of follicles

Francis Coffey et al. Immunity. .

Abstract

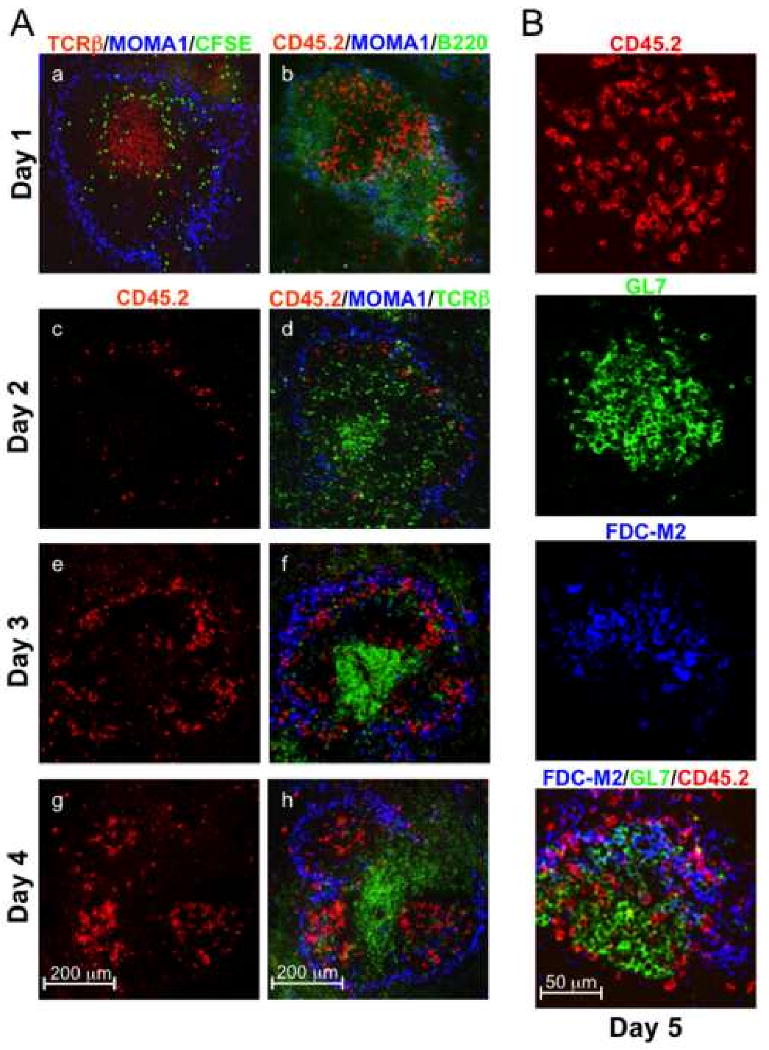
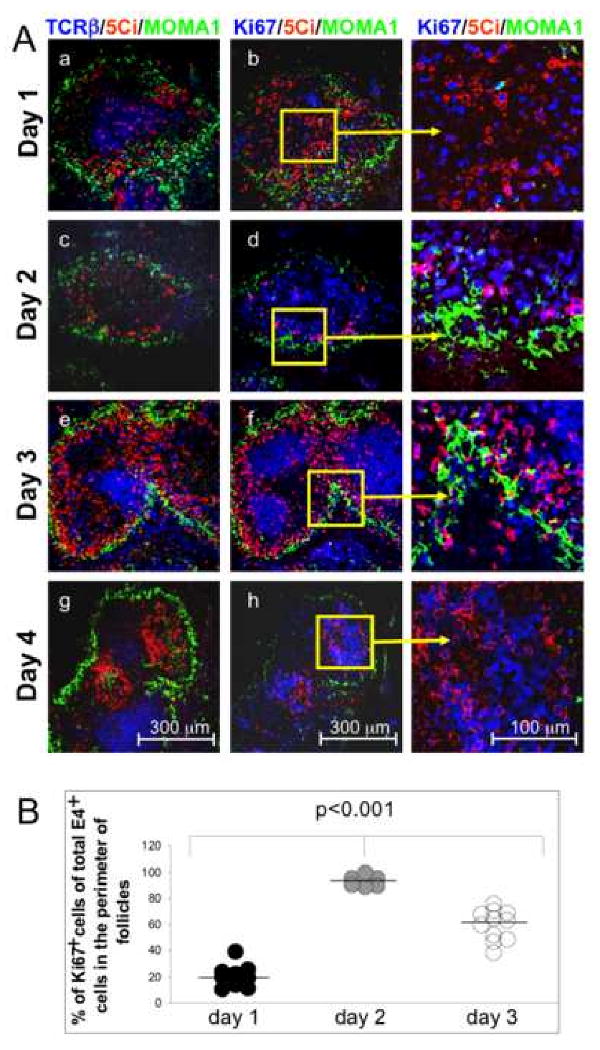
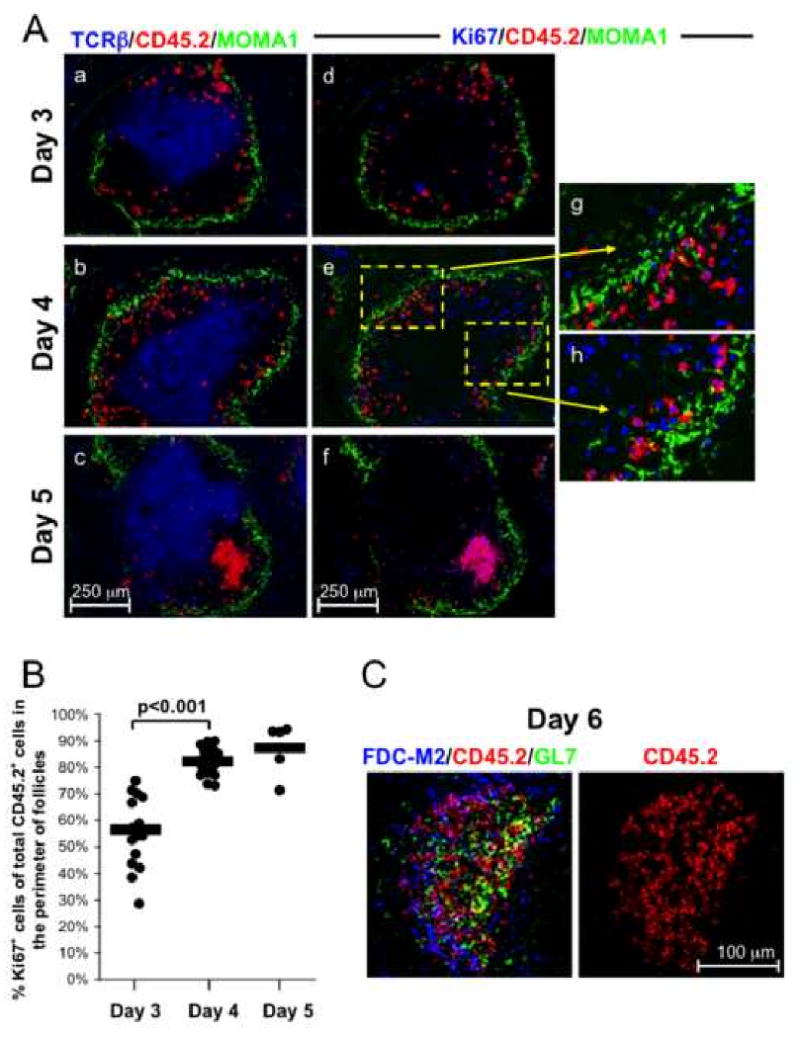
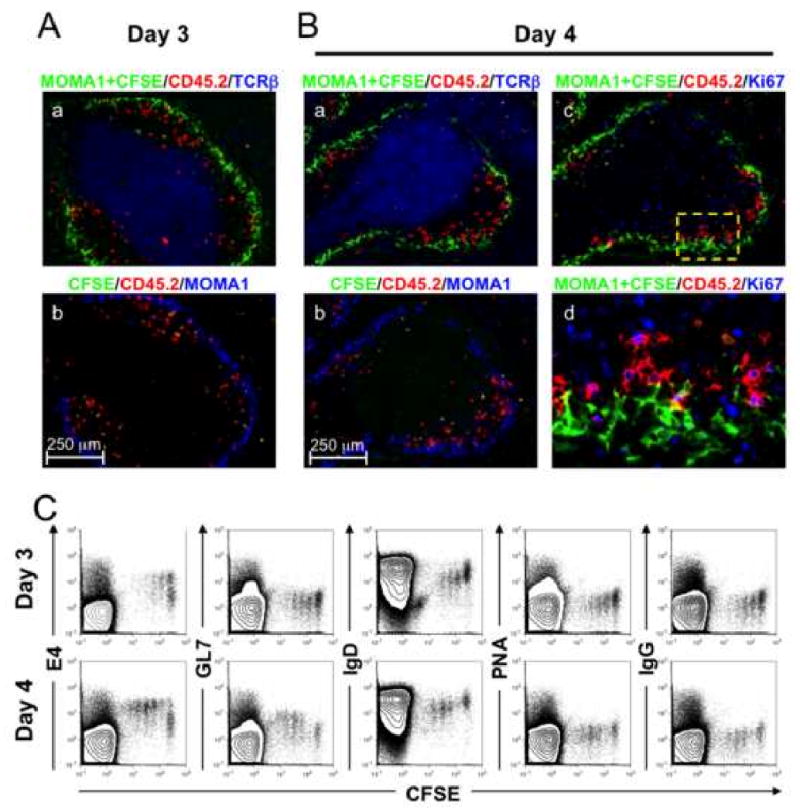
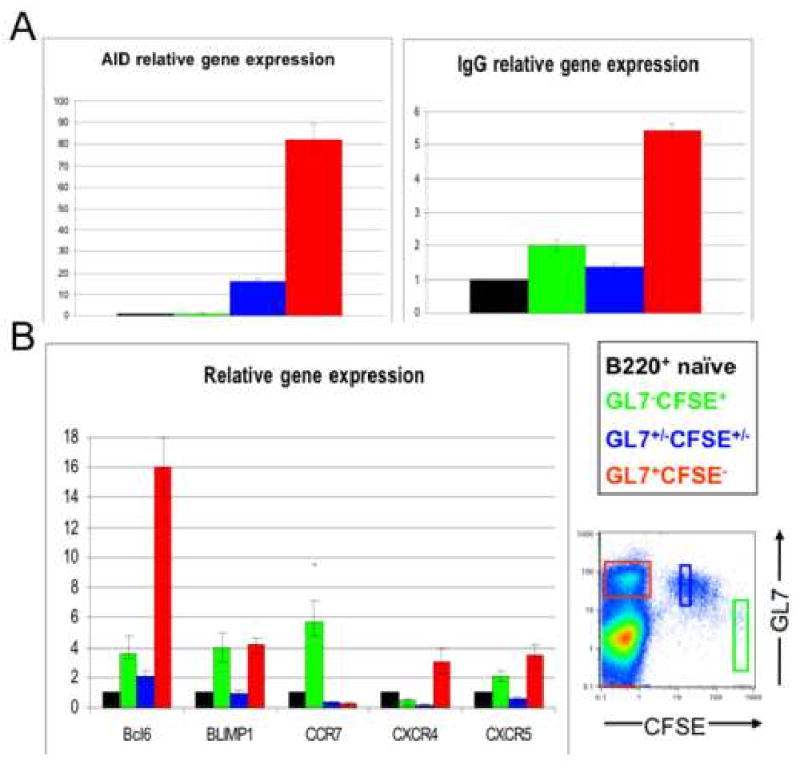
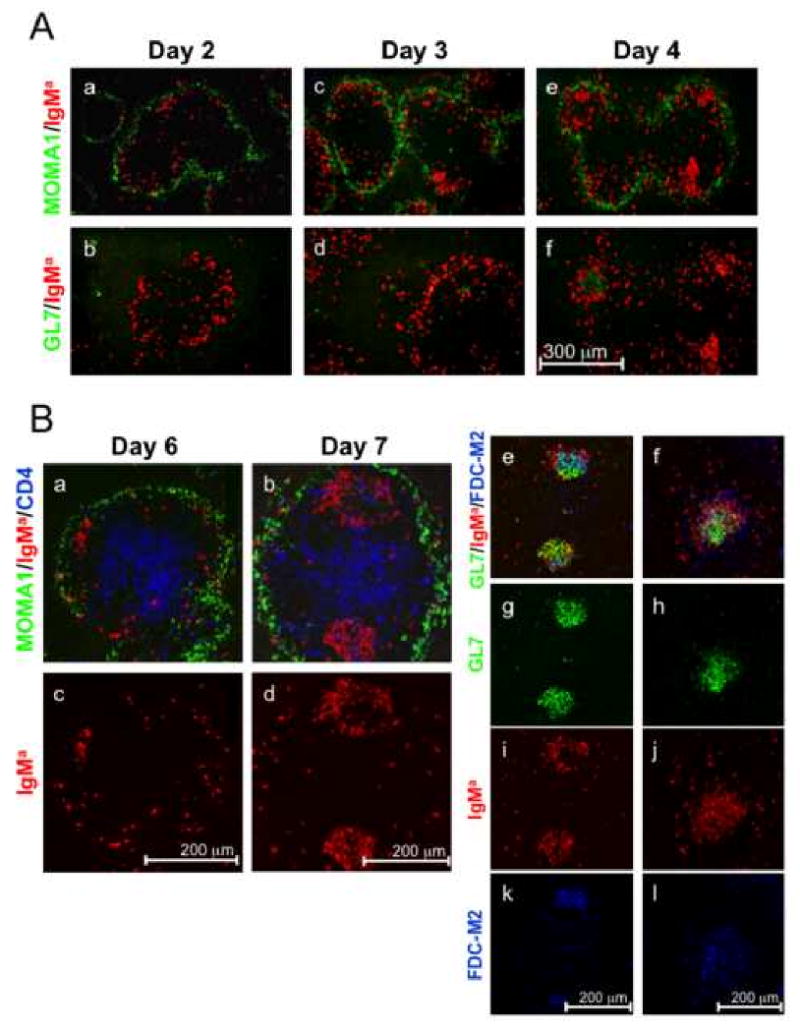
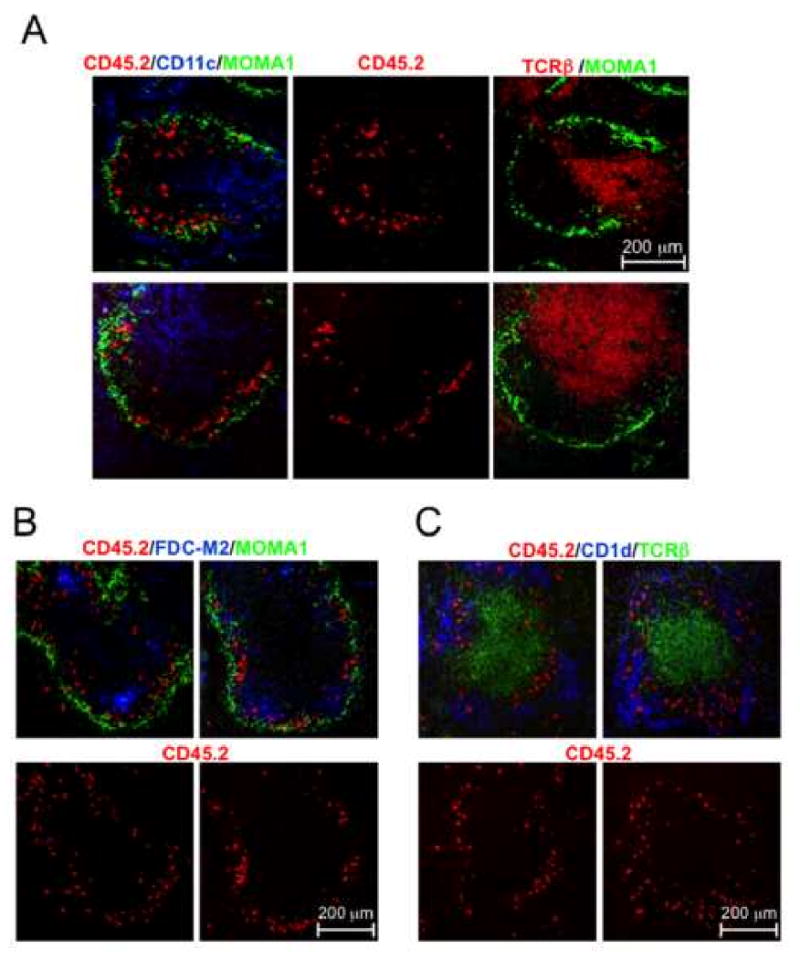
Current models of the germinal center (GC) response propose that after stimulation at the edges of T cell zones, pre-GC B cells directly migrate to the center of follicles and proliferate to form GCs. We followed the interrelationship of proliferation, differentiation, and microenvironmental locale in populations of pre-GC B cells responding to antigen. In contrast to the predictions of current models, after accumulation at the T-B interface, these cells appeared at the perimeter of follicles adjacent to the marginal zone. There, they rapidly proliferated for several days but underwent no V gene hypermutation and little heavy-chain class switching. Their chemokine receptor expression pattern indicated that these cells were sessile, yet they had begun to acquire many phenotypic characteristics of GC B cells. The expanded clones were subsequently observed in the center of follicles, suggesting that GCs are created by coalescence of B cells from this follicular perimeter response.


Figures

Figure 1
Figure 1. Micro environmental locale of HKI65/Vk10 donor B cells during the first four days of the immune response in Ars-KLH pre-immunized mice
Recipient mice were primed with 100 μg of Ars-KLH in alum i.p. and injected with HKI65/Vk10 B cells six days later, then sacrificed at different time points and spleen sections analyzed as described in Experimental Procedures. (A) Panel a illustrates the localization of CFSE labeled donor B cells (107 injected per recipient mouse), which appear green, on the first day after transfer. Panel b shows donor B cells (107 injected per recipient mouse) expressing the CD45.2 allotypic marker (red) concentrated at the interface of B (green) and T (unstained) cell zones. Panels c-h illustrate the location of CD45.2+ donor B cells (red, 2×10⁴ injected per recipient mouse) at days two through four after immunization (adjacent sections next to each other). MOMA1 staining (blue) was used to identify metallophiles in the marginal zone, delineating the follicular border. T cells appear green. The data shown are representative of those obtained from at least three mice from each time point. (B) Representative images of a germinal center at day five after transfer. Donor B cells (2×10⁴ injected per recipient mouse), stained with anti-CD45.2 appear red, GL7 positive cells appear green, FDC-M2 staining appears blue. The scale is shown below each column of panels.
Figure 2
Figure 2. Proliferation of HKI65/Vk10 donor B cells at the perimeter of follicles in pre-immunized mice
Chimeric HKI65/Vk10 mice were created and immunized as described in the legend to Figure 1. (A) Panels a, c, e and g illustrate the location of donor 5Ci+ B cells (red), T cells (blue) and MZ metallophiles (green) at different time points during the course of the Ars-KLH response. Panels b, d, f and h show the result of staining of adjacent sections for the Ki67 nuclear proliferation antigen (blue), donor B cells (red) and MZ metallophiles (green). The right column of images are magnified regions of areas delineated by the yellow rectangles in panels b, d, f and h. The scale is shown below each column of panels. Data were obtained from mice injected with the following numbers of donor B cells: panels a and b, 107; panels e and f, 106; panels c, d, g and h, 2×10⁵. The data shown are representative of those obtained from at least three mice from each time point. (B) Quantitative analysis of E4+ B cell proliferation at the perimeter of follicles on the indicated days. Data obtained represent the percentage of canonical HKI65/Vk10 E4+ B cells that were also Ki67+ counted within 15 cell diameters from the band of MOMA1+ cells that delineate the MZ-follicle border. Each circle represents data from an individual field along this border. Data were obtained from three mice for days one and three and from two mice for day two.
Figure 3
Figure 3. HKI65/Vk10 B cell localization to and proliferation at the follicular perimeter does not require pre-immunization
Experiments were performed as described in the Legends to Figures 1 and 2 except that recipient mice were not pre-immunized. Instead, chimeric mice were immunized 12 hours after cell transfer with Ars-KLH in alum i.p.. In all experiments illustrated, 105 purified donor splenic B cells were injected per recipient. (A) Adjacent spleen sections obtained at the indicated time points after immunization were stained with antibodies specific for the indicated markers. The scales for images a-f are indicated in the lower panels of each column. The images in the right column are magnified regions of areas delineated by the yellow rectangles in panel e. (B) Quantitative analysis of CD45.2+ B cell proliferation at the perimeter of follicles on the indicated days. Data obtained represent the percentage of canonical HKI65/Vk10 CD45.2+ B cells that were also Ki67+ counted within 15 cell diameters from the band of MOMA1+ cells that delineate the MZ-follicle border. Each circle represents data from an individual field along this border. Data were obtained from three experiments, where 3-4 mice were sacrificed at each time point. (C) Spleen sections obtained from chimeric mice six days after immunization were stained with antibodies specific for the indicated markers. A three-color and single-color image of a representative GC is shown. The scale of the images is indicated in the right panel.
Figure 4
Figure 4. HKI65/Vk10 B cell proliferation and changes in cell surface phenotype during the response at the follicular perimeter
Chimeric mice were generated and immunized as described in the legend to Figure 3 using CFSE labeled donor B cells. Spleens isolated at the indicted time points were halved so that one portion could be analyzed by immunofluorescence staining and the other by flow cytometry. In all illustrated experiments 3×10⁶ donor splenic B cells were injected per recipient mouse. (A) Adjacent spleen sections obtained on day 3 after immunization were stained with Abs specific for the indicated markers and analyzed by immunofluorescence microscopy. The scale for panels a and b is shown in b. (B) Panels a, b and c are images obtained from adjacent sections on day 4. A scale for images a, b. and c is shown b. Panel d is a magnified image of the region in c surrounded by a dashed rectangle. (C) Spleen cells were stained with the indicated antibodies or reagents and expression levels of the various detected markers were analyzed as a function of CFSE fluorescence intensity by flow cytometry. Dilution of CFSE fluorescence in donor cells was not detected until day 3. The data in this figure are representative of those obtained in three independent experiments where 2-3 mice were sacrificed on each day.
Figure 5
Figure 5. Gene expression profile of HKI65/Vk10 donor B cells after different numbers of cell divisions during the follicular perimeter response
Ars-KLH-primed recipient mice were injected with CFSE labeled splenocytes from HKI65/Vk10 mice as described in the Legend to Figure 1 and Experimental Procedures and sacrificed on day three after transfer. (A and B) Spleen cells from the chimeric mice were stained with anti-B220 and GL7 Abs, and B cells in different CFSE dilution subpopulations were sorted by FACS (see lower right inset). QRT-PCR analyses were performed on RNA extracted from B220+GL7+/-, CFSE+/- cells in division peak 5 (blue), B220+GL7-, CFSE+ cells in division peak 0 (green) and B220+GL7+, CFSE- cells, representing germinal center B cells (red). RNA isolated from B cells of naïve C57BL/6 mice (black) served as a reference control whose QRT-PCR value for each assay was arbitrarily set to one.
Figure 6
Figure 6. Proliferation and locale of anti-HEL transgenic B cells during the immune response to HEL
(A) Tg(IghelMD4)4Ccg/J splenocytes (106 per recipient mouse) were adoptively transferred into non-irradiated C57BL/6 mice primed three days earlier with 100 μg of HEL in alum and immediately boosted with 50 μg soluble HEL i.p. On days two, three and four after adoptive transfer, donor cell locale was analyzed by immunohistology using Abs specific for the indicated markers. Panels e and f are images obtained from adjacent sections. Image scale is indicated in panel f. At days two and three after transfer, donor B cells (red) can be seen at the perimeter of follicles and at day four they also can be detected in GCs. Small GL7+ nascent GCs (green, panel f) were detected in some follicles at day four. The data shown are representative of those obtained from at least two mice at each time point. (B) Studies analogous to those described for part (A) were performed but the post immunization protocol was used. In these experiments, 106 donor spleen cells were injected into each recipient mouse. Panels c and d show single-color images acquired for a and b, respectively. Panels e-l illustrate donor B cells located within GCs (yellow fluorescence resulting from overlap of IgMa and GL7 staining). Scales for each column of panels are indicated in the bottom panels. The data are representative of images acquired from three separate experiments, where 3-4 mice were sacrificed on each day.
Figure 7
Figure 7. Location of accessory cells during the HKI65/Vk10 B cell proliferative response at the follicular perimeter
Chimeric mice immunized with Ars-KLH 12 hours after donor cell transfer, were killed at day four of the response, and spleens analyzed by immunohistology using Abs specific for the indicated markers. In all experiments 105 purified donor splenic B cells were injected per recipient mouse. (A) Location of donor B cells, T cells and CD11c DCs. Two examples of data obtained from adjacent sections (top and bottom three panels) are shown. Image scale is indicated in the upper right panel. (B) Location of donor B cells and FDCs. Examples of data from two sets of adjacent sections (upper and lower panels) are shown. Image scale is indicated in the upper right panel. (C) Location of donor B cells and CD1d+ (mainly MZ) B cells. Examples of data from two sets of adjacent sections are illustrated as in (B). Notice the lack of overlap of CD1d (blue) staining and donor (CD45.2, red) staining. Image scale is indicated in the lower right panel.

References

    1. Allen CD, Ansel KM, Low C, Lesley R, Tamamura H, Fujii N, Cyster JG. Germinal center dark and light zone organization is mediated by CXCR4 and CXCR5. Nat Immunol. 2004;9:943–952. - PubMed
    1. Allen CD, Okada T, Tang HL, Cyster JG. Imaging of germinal center selection events during affinity maturation. Science. 2007;5811:528–531. - PubMed
    1. Allman D, Jain A, Dent A, Maile RR, Selvaggi T, Kehry MR, Staudt LM. BCL-6 expression during B-cell activation. Blood. 1996;12:5257–5268. - PubMed
    1. Berek C, Berger A, Apel M. Maturation of the immune response in germinal centers. Cell. 1991;67:1121–1129. - PubMed
    1. Berney C, Herren S, Power CA, Gordon S, Martinez-Pomares L, Kosco-Vilbois MH. A member of the dendritic cell family that enters B cell follicles and stimulates primary antibody responses identified by a mannose receptor fusion protein. J Exp Med. 1999;190:851–860. - PMC - PubMed

Publication types