. 2009 Mar 20;136(6):1110-21.
doi: 10.1016/j.cell.2009.01.032.

A phosphoinositide switch controls the maturation and signaling properties of APPL endosomes

Affiliations

A phosphoinositide switch controls the maturation and signaling properties of APPL endosomes

Roberto Zoncu et al. Cell. .

Abstract

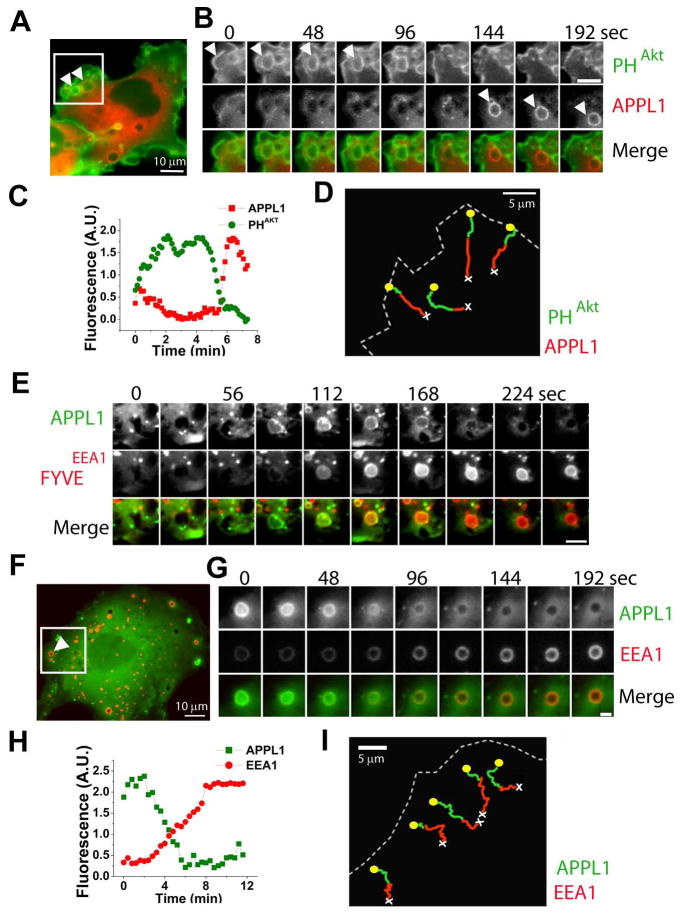
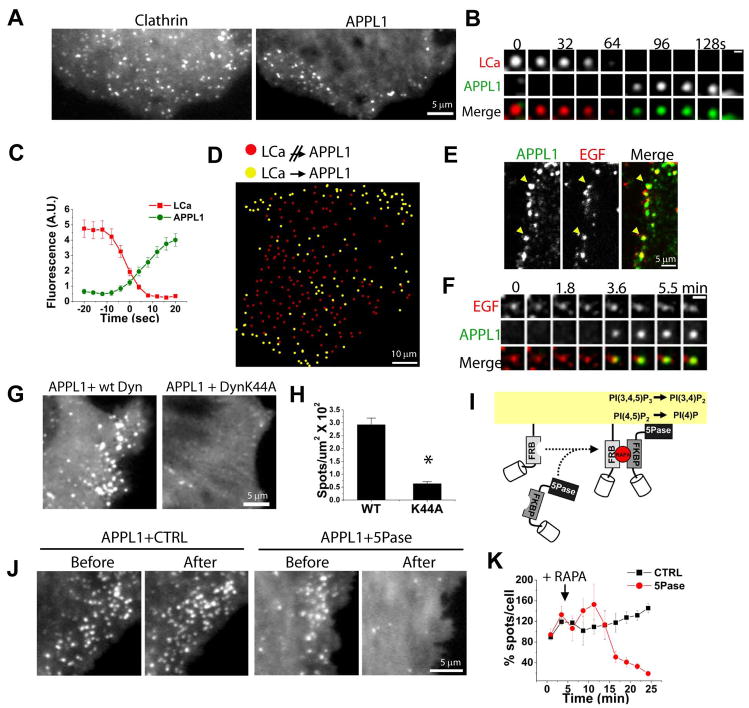
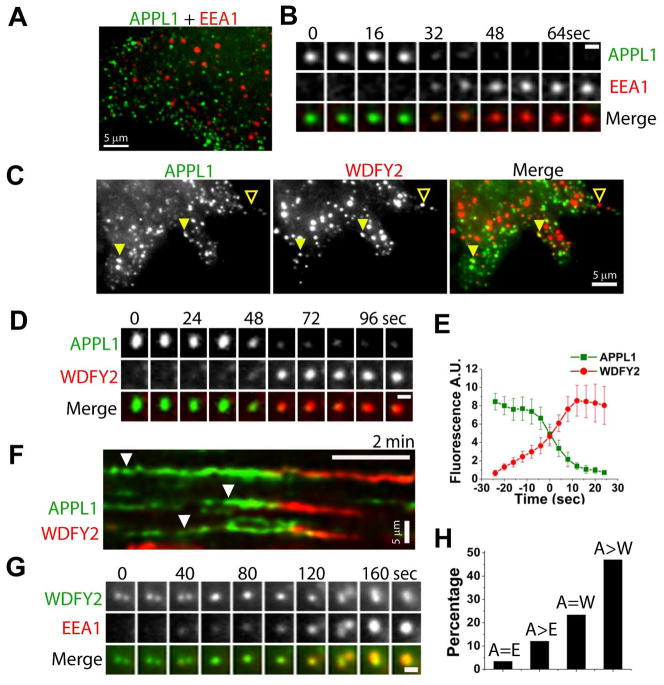
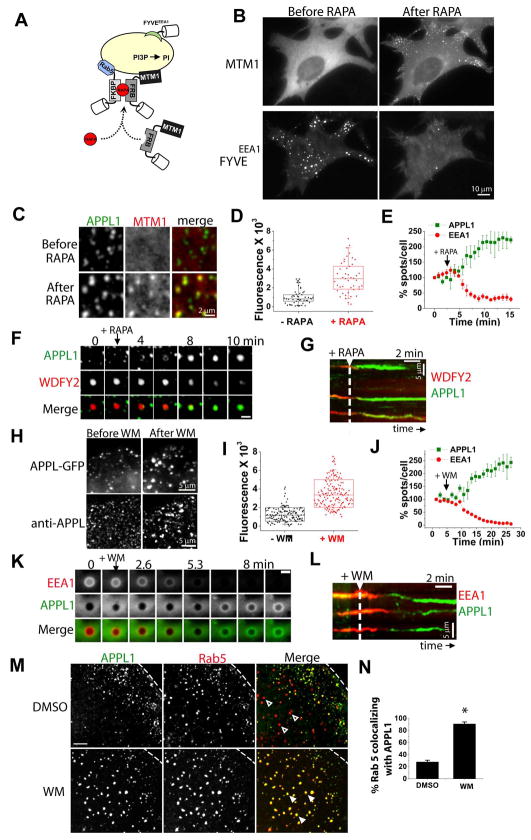
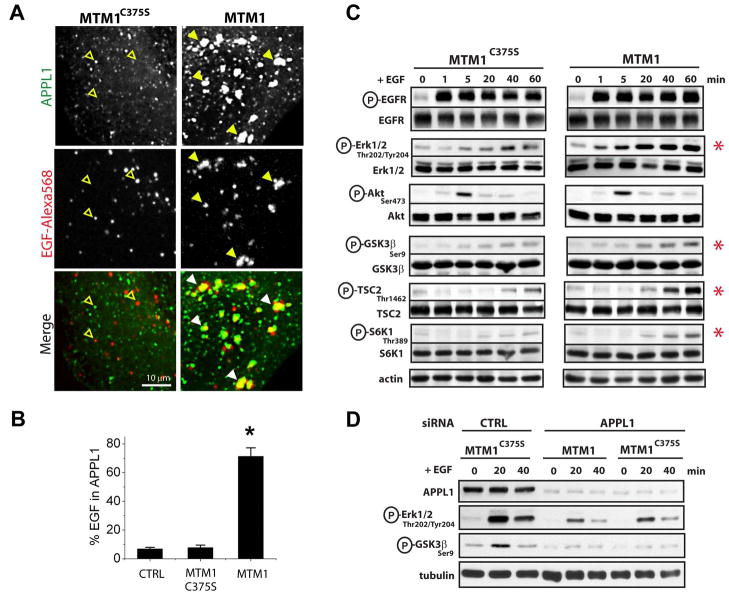
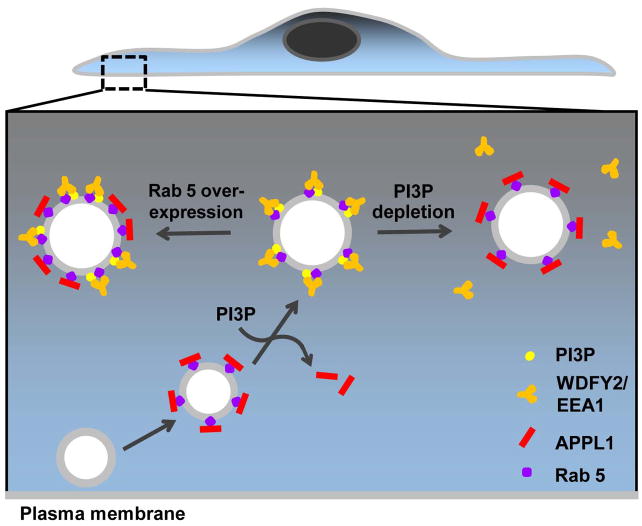
The recent identification of several novel endocytic compartments has challenged our current understanding of the topological and functional organization of the endocytic pathway. Using quantitative single vesicle imaging and acute manipulation of phosphoinositides we show that APPL endosomes, which participate in growth factor receptor trafficking and signaling, represent an early endocytic intermediate common to a subset of clathrin derived endocytic vesicles and macropinosomes. Most APPL endosomes are precursors of classical PI3P positive endosomes, and PI3P plays a critical role in promoting this conversion. Depletion of PI3P causes a striking reversion of Rab5 positive endosomes to the APPL stage, and results in enhanced growth factor signaling. These findings reveal a surprising plasticity of the early endocytic pathway. Importantly, PI3P functions as a switch to dynamically regulate maturation and signaling of APPL endosomes.


Figures

Figure 1
Figure 1. Mapping APPL1 in the early endocytic pathway
Epifluorescence images. (A) COS7 cell co-expressing GFP-PHAkt (green), mRFP-APPL1 (red) and H-RasV12G. Arrowheads show large H-RasV12G-generated pinosomes. See also movie S1 corresponding (boxed region). (B) Sequential images of an H-RasV12G-induced pinosome from the cell in (A). Scale bar = 5μm. (C) Integrated fluorescence/time plot of the pinosome in (B). (D) Manual tracking of 4 pinosomes from the region boxed in (A), showing GFP-PHAkt (green) and mRFP-APPL1 (red) over time. Yellow circles and white crosses show track start and track end respectively. (E) Gallery of one H-RasV12G-induced pinosome from a COS7 cell co-expressing GFP-APPL1 (green, top) and FYVEEEA1 (red, middle). Scale bar = 2μm. (F) COS7 cell co-expressing GFP-APPL1 (green), mRFP-EEA1 (red) and H-RasV12G. Arrowhead shows a large H-RasV12G-induced pinosome. See also movie S2 (boxed region). (G) Sequential images of the pinosome indicated in (F), showing shedding of APPL1 (green, top) and acquisition of EEA1 (red, middle). Scale bar = 2μm. (H) Integrated fluorescence/time plot of the pinosome in (F). (I) Manual tracking of 5 pinosomes from the region boxed in (E).
Figure 2
Figure 2. A subpopulation of clathrin coated pits directly generate APPL endosomes
(A) TIRF snapshots of a COS7 cell co-expressing LCa-mRFP (left) and GFP-APPL1 (right). (B) TIRF gallery from a COS7 cell expressing LCa-mRFP (red, top) and GFP-APPL1 (green, middle) showing conversion of a CCP into an APPL1 endosome. Scale bar = 1 μm. (C) Average fluorescence/time plot of 15 LCa-mRFP spots, time-aligned by the conversion to GFP-APPL1. (D) Spatial mapping of APPL1 endosome generation. Yellow and red circles indicate clathrin coated pits which do or do not give rise to an APPL1 endosome, respectively. (E) Spinning disk confocal image of a HeLa cell stained for endogenous APPL1 (green) after a 5 min pulse with EGF-Alexa 488 (red). Arrowheads mark APPL1 endosomes containing EGF-Alexa 488. (F) Sequential images of mRFP-APPL (green, middle) on an endocytic vesicle containing EGF-Alexa 488 (red, top). Scale bar = 2 μm. (G) Snapshots of GFP-APPL1 from two COS7 cells co-expressing Dyn2-mRFP (left) and Dyn2K44A-mRFP (right). (H) Average number of GFP-APPL1 spots/μm2 from cells co-expressing Dyn2-mRFP (left) and Dyn2K44A-mRFP (right) (n = 60 cells; p < 0.001). (I) Heterodimerization of mRFP-FKBP-5Pase to membrane-anchored CFP-FRB domain following addition of the rapalogue (RAPA) (Zoncu et al., 2007). (J) Regions from COS7 cells showing GFP-APPL1 before and after rapalogue-mediated plasma membrane recruitment of a catalytically inactive 5Pase (left) or the 5Pase construct (right). See also movie S5. (K) Averaged and normalized number of APPL1 spots over time from three cells where PI(4,5)P2 was depleted (5Pase, red), and three control cells (CTRL, black).
Figure 3
Figure 3. APPL endosomes are precursors of the EEA1 population via WDFY2 endosomes
(A) Spinning disk confocal image of a COS7 cell co-expressing GFP-APPL1 (green) and mRFP-EEA1 (red). (B) Epifluorescence gallery showing conversion of an APPL1 endosome (green, top) into an EEA1 endosome (red, middle). Scale bar = 1 μm. (C) TIRF image of a COS7 cell co-expressing mRFP-APPL1 (left, green) and GFP-WDFY2 (middle, red). Solid and empty arrowheads indicate colocalization and non-colocalization, respectively. (D) TIRF gallery showing conversion of an APPL1 endosome (green, top) into a WDFY2 endosome (red, middle). Scale bar = 1 μm. (E) Average fluorescence/time plot from 10 mRFP-APPL1 spots, time-aligned by the conversion to GFP-WDFY2. (F) Kymograph showing conversion of three APPL1 endosomes (arrowheads) into WDFY2 endosomes. (G) TIRF gallery showing small WDFY2 organelles (green, top) which merge into larger spots as they acquire EEA1 (red, middle). Scale bar = 1 μm. (H) Colocalization analysis between APPL1 and EEA1 (A=E; n = 235 from 3 cells), conversion of APPL1 to EEA1 spots (A>E; n = 141 from 3 cells), colocalization of APPL1 and WDFY2 (A=W; n = 411 from 3 cells), and conversion of APPL1 to WDFY2 spots (A>W; n = 113 from 3 cells).
Figure 4
Figure 4. Expansion of the APPL compartment following inducible PI3P depletion
(A) Heterodimerization of mRFP-FRB-MTM1 to endosomal anchored CFP-FKBP×2-Rab5 upon addition of a rapalogue (RAPA) (Fili et al., 2006). (B) Epifluorescence snapshots of a COS7 cell co-expressing CFP-FKBP×2-Rab5 (not shown), mRFP-FRB-MTM1 (MTM1, top) and FYVEEEA1 (bottom), before (left) and after (right) rapalogue addition. See also Movie S7. (C) Details from a cell expressing GFP-APPL1 (green, left) and mRFP-FRB-MTM1 (red, middle), before (top) and after (bottom) rapalogue addition. See also Movie S8. (D) Box chart of the integrated fluorescence of GFP-APPL1 spots before (black) and after (red) rapalogue addition (n = 45 spots for each). Center line= mean. (E) Averaged (n = 3 cells) and normalized number of APPL1 (green) and EEA1 (red) spots over time following recruitment of mRFP-FRB-MTM1. (F) TIRF gallery from a COS7 cell expressing WDFY2 (red, middle), APPL1 (green, top), CFP-FKBP×2-Rab5 and CFP-FRB-MTM1. Loss of WDFY2 coincides with acquisition of APPL1 following PI3P depletion. Scale bar = 1 μm. (G) Kymograph showing reversion of three WDFY2 endosomes back to an APPL1 stage following PI3P depletion (arrow). (H) Details from a cell expressing GFP-APPL1 (top panel) before (left) and after (right) treatment with 30 nM wortmannin (WM). Bottom panels show endogenous APPL1 staining following DMSO (left) or WM (right). (I) Box chart of the integrated fluorescence of GFP-APPL1 spots before (black) and after (red) WM (n = 150 spots for each). Center line = mean. (J) Averaged (n = 3 cells) and normalized number of APPL1 (green) and EEA1 (red) spots over time following WM treatment. (K) Epifluorescence gallery showing reversion of an EEA1-positive macropinosome (top, red) to APPL1-positive (middle, red) following addition of 30 nM WM. Scale bar = 1 μm. (L) Kymograph showing reversion of three WDFY2 endosomes back to APPL1 positive endosomes after treatment with WM (arrow). (M) COS7 cells expressing GFP-APPL1 and mRFP-Rab5 treated with DMSO (top) or 30 nM WM (bottom). (N) Percentage colocalization of Rab5 with APPL1 following DMSO or WM treatment (n = 650 from 13 cells; p < 0.001).
Figure 5
Figure 5. Increased EGF signaling in enlarged APPL endosomes
(A) Spinning disk confocal images of HeLa cells expressing GFP-APPL1 (top row, green), CFP-FKBP×2-Rab5 (not shown) and either CFP-FRB-MTM1C375S (left panels) or CFP-FRB-MTM1 (right panels). Cells were pre-treated with rapalogue for 15 min and then at 4 °C with EGF-Alexa 568 (middle row, red). After 1-hour chase, colocalization between GFP-APPL1 and EGF-Alexa 568 was determined. Accumulation of EGF-Alexa 568 in enlarged APPL1 endosomes is shown by arrowheads. EGF-Alexa 568 positive, APPL negative, organelles are shown by empty arrowheads. (B) Pixel-by-pixel quantification of the overlap of EGF-Alexa 568 with GFP-APPL1 in (A). CTRL = no recruitable constructs transfected. C375S = catalytically inactive myotubularin 1. MTM1 = wild type myotubularin 1 (n = 5 cells for CTRL, 10 cells for C375S and MTM1; p < 0.001) (C) HeLa cells co-expressing GFP-FKBP×2-Rab5 and either mRFP-FRB-MTM1C375S (left) or mRFP-FRB-MTM1 (right) were treated with rapalogue and EGF (1.5 ng/ml) for the indicated times, and phosphorylation of downstream EGFR effectors was determined by western blotting. Actin is a loading control. (D) HeLa cells treated with control or APPL1 siRNA were transfected with GFP-FKBP×2-Rab5 and either mRFP-FRB-MTM1C375S or mRFP-FRB-MTM1 as indicated. Cells were treated as in ‘C’ and phosphorylation of downstream EGFR effectors was determined.
Figure 6
Figure 6. APPL endosomes as an intermediate station in traffic to PI3P positive endosomes
Newly-formed endocytic vesicles generated at the cell edge mature into APPL1-positive (red bars), Rab5 positive (purple circles) signaling endosomes. As APPL endosomes move centripetally and PI3P is generated, APPL1 is shed and replaced by PI3P binding proteins, WDFY2/EEA1 (orange) possibly as a result of competition for Rab5 binding. PI3P depletion or inhibition of hVps34 causes reversion back to APPL1 positive endosomes (right). In contrast, increasing the amount of Rab5 allows the simultaneous presence of APPL1 and PI3P binding proteins on the same endosomes (left).

References

    1. Behnia R, Munro S. Organelle identity and the signposts for membrane traffic. Nature. 2005;438:597–604. - PubMed
    1. Colaluca IN, Tosoni D, Nuciforo P, Senic-Matuglia F, Galimberti V, Viale G, Pece S, Di Fiore PP. NUMB controls p53 tumour suppressor activity. Nature. 2008;451:76–80. - PubMed
    1. Damke H, Baba T, Warnock DE, Schmid SL. Induction of mutant dynamin specifically blocks endocytic coated vesicle formation. J Cell Biol. 1994;127:915–934. - PMC - PubMed
    1. De Matteis MA, Di Campli A, Godi A. The role of the phosphoinositides at the Golgi complex. Biochim Biophys Acta. 2005;1744:396–405. - PubMed
    1. Di Fiore PP, De Camilli P. Endocytosis and signaling. an inseparable partnership. Cell. 2001;106:1–4. - PubMed

Publication types

Substances