

Testing the influenza-tuberculosis selective mortality hypothesis with Union Army data
- PMID: 19304361
- PMCID: PMC2677170
- DOI: 10.1016/j.socscimed.2009.02.021
Testing the influenza-tuberculosis selective mortality hypothesis with Union Army data
Abstract
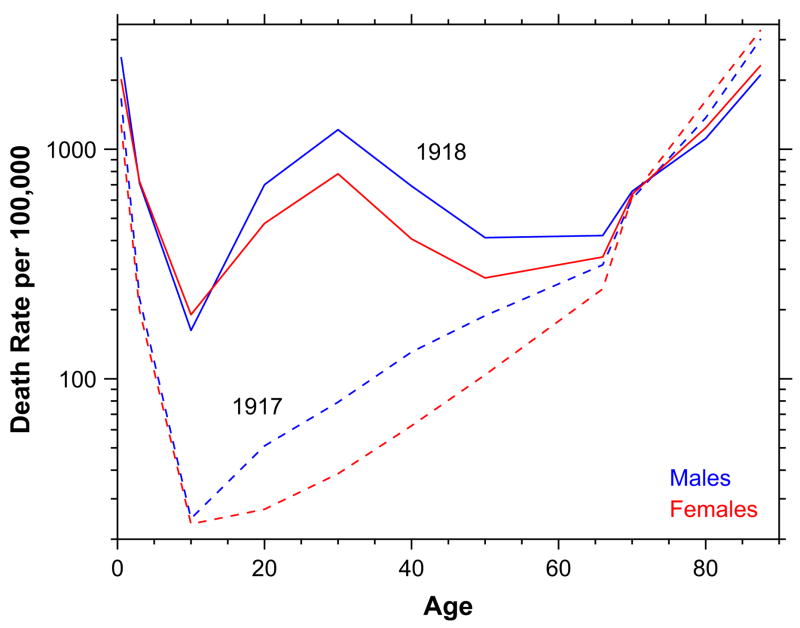
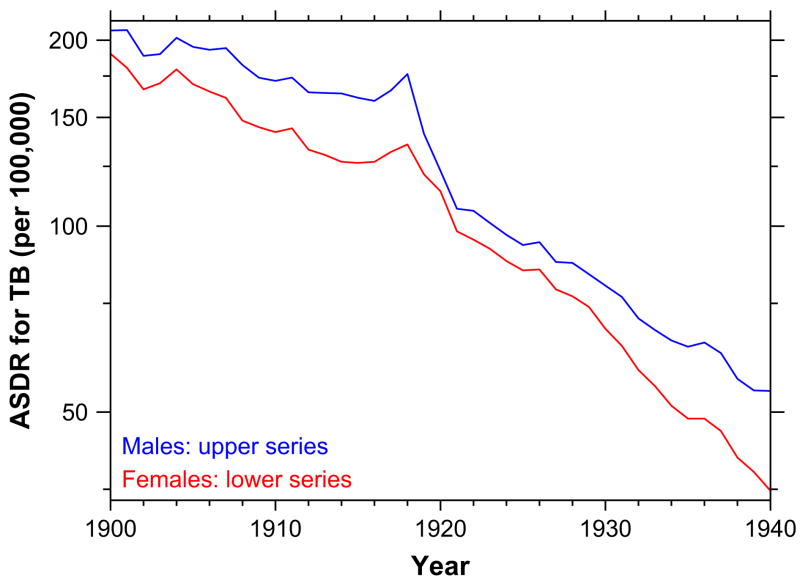
Using Cox regression, this paper shows a weak association between having tuberculosis and dying from influenza among Union Army veterans in late nineteenth-century America. It has been suggested elsewhere [Noymer, A. and M. Garenne (2000). The 1918 influenza epidemic's effects on sex differentials in mortality in the United States. Population and Development Review 26(3), 565-581.] that the 1918 influenza pandemic accelerated the decline of tuberculosis, by killing many people with tuberculosis. The question remains whether individuals with tuberculosis were at greater risk of influenza death, or if the 1918/post-1918 phenomenon arose from the sheer number of deaths in the influenza pandemic. The present findings, from microdata, cautiously point toward an explanation of Noymer and Garenne's selection effect in terms of age-overlap of the 1918 pandemic mortality and tuberculosis morbidity, a phenomenon I term "passive selection". Another way to think of this is selection at the cohort, as opposed to individual, level.
Figures
References
-
- Aho AV, Kernighan BW, Weinberger PJ. The AWK programming language. Reading, Massachusetts: Addison-Wesley; 1988.
-
- Almond D, Mazumder B. The 1918 influenza pandemic and subsequent health outcomes: an analysis of SIPP data. American Economic Review: Papers and Proceedings. 2005;95(2):258–262. - PubMed
-
- Beckett WW. Proceedings of the thirty-third annual meeting of the Association of Life Insurance Medical Directors of America. Vol. 9. New York: The Knickerbocker Press; 1923. Tuberculosis in its relation to life insurance. (Abstract) pp. 115–126.
-
- Bengtsson T, Lindström M. Childhood misery and disease in later life: the effects on mortality in old age of hazards experienced in early life, southern Sweden, 1760–1894. Population Studies. 2000;54(3):263–277. - PubMed
-
- Birchenall JA. Airborne diseases: Tuberculosis in the Union Army. Santa Barbara: University of California. (Mimeo); 2006.
Publication types
MeSH terms
Grants and funding
LinkOut - more resources
Full Text Sources
Medical
