

Influence of stress on single-cell lag time and growth probability for Listeria monocytogenes in half Fraser broth
- PMID: 19304822
- PMCID: PMC2681640
- DOI: 10.1128/AEM.02864-08
Influence of stress on single-cell lag time and growth probability for Listeria monocytogenes in half Fraser broth
Abstract
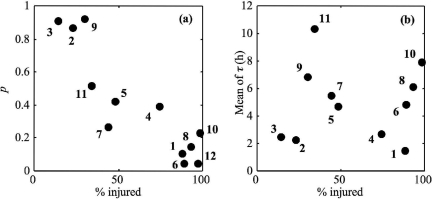
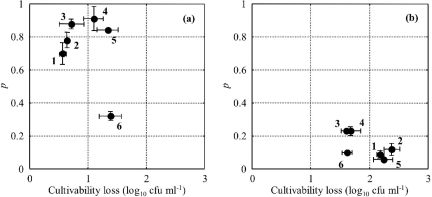
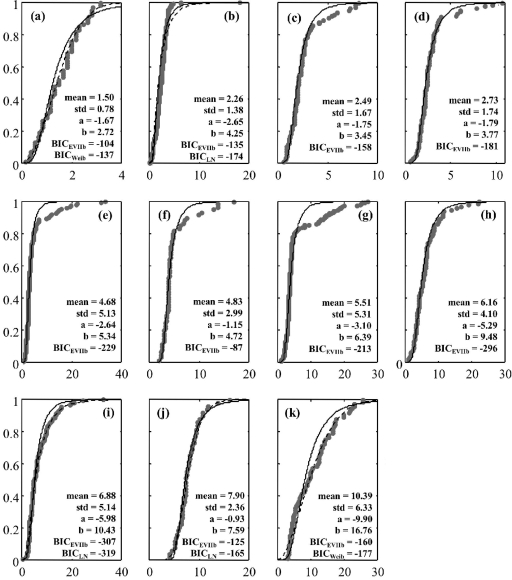
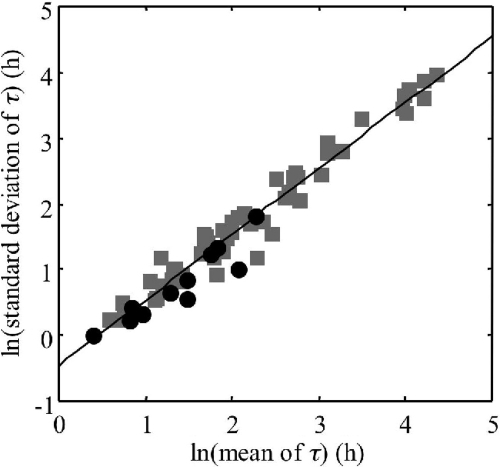
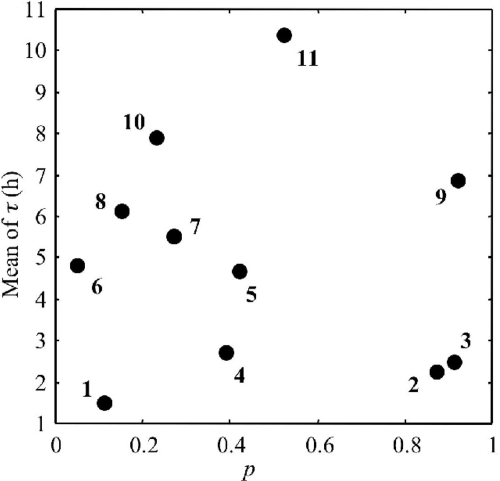
The impacts of 12 common food industry stresses on the single-cell growth probability and single-cell lag time distribution of Listeria monocytogenes were determined in half Fraser broth, the primary enrichment broth of the International Organization for Standardization detection method. First, it was determined that the ability of a cell to multiply in half Fraser broth is conditioned by its history (the probability for a cell to multiply can be decreased to 0.05), meaning that, depending on the stress in question, the risk of false-negative samples can be very high. Second, it was established that when cells are injured, the single-cell lag times increase in mean and in variability and that this increase represents a true risk of not reaching the detection threshold of the method in the enrichment broth. No relationship was observed between the impact on single-cell lag times and that on growth probabilities. These results emphasize the importance of taking into account the physiological state of the cells when evaluating the performance of methods to detect pathogens in food.
Figures
Similar articles
-
Variability in lag duration of Listeria monocytogenes strains in half Fraser enrichment broth after stress affects the detection efficacy using the ISO 11290-1 method.Int J Food Microbiol. 2021 Jan 16;337:108914. doi: 10.1016/j.ijfoodmicro.2020.108914. Epub 2020 Oct 20. Int J Food Microbiol. 2021. PMID: 33166913
-
Heterogeneity in single-cell outgrowth of Listeria monocytogenes in half Fraser enrichment broth is affected by strain variability and physiological state.Food Res Int. 2021 Dec;150(Pt A):110783. doi: 10.1016/j.foodres.2021.110783. Epub 2021 Oct 29. Food Res Int. 2021. PMID: 34865798
-
Modeling the behavior of Listeria monocytogenes during enrichment in half Fraser broth; impact of pooling and the duration of enrichment on the detection of L. monocytogenes in food.Food Microbiol. 2016 Dec;60:131-6. doi: 10.1016/j.fm.2016.07.004. Epub 2016 Jul 15. Food Microbiol. 2016. PMID: 27554154
-
Detection and isolation of Listeria monocytogenes from food samples: implications of sublethal injury.J AOAC Int. 2002 Mar-Apr;85(2):495-500. J AOAC Int. 2002. PMID: 11990037 Review.
-
Culture media and methods for the isolation of Listeria monocytogenes.Int J Food Microbiol. 1995 Jun;26(1):1-13. doi: 10.1016/0168-1605(93)e0027-o. Int J Food Microbiol. 1995. PMID: 7662515 Review.
Cited by
-
An Accurate Method for Studying Individual Microbial Lag: Experiments and Computations.Front Microbiol. 2021 Nov 4;12:725499. doi: 10.3389/fmicb.2021.725499. eCollection 2021. Front Microbiol. 2021. PMID: 34803943 Free PMC article.
-
Variability in Cell Response of Cronobacter sakazakii after Mild-Heat Treatments and Its Impact on Food Safety.Front Microbiol. 2016 Apr 19;7:535. doi: 10.3389/fmicb.2016.00535. eCollection 2016. Front Microbiol. 2016. PMID: 27148223 Free PMC article.
-
Inoculation density is affecting growth conditions of Listeria monocytogenes on fresh cut lettuce.World J Microbiol Biotechnol. 2017 Nov 27;33(12):217. doi: 10.1007/s11274-017-2379-2. World J Microbiol Biotechnol. 2017. PMID: 29181800
-
Integrated kinetic and probabilistic modeling of the growth potential of bacterial populations.Appl Environ Microbiol. 2015 May 1;81(9):3228-34. doi: 10.1128/AEM.04018-14. Epub 2015 Mar 6. Appl Environ Microbiol. 2015. PMID: 25747002 Free PMC article.
-
Colonial vs. planktonic type of growth: mathematical modeling of microbial dynamics on surfaces and in liquid, semi-liquid and solid foods.Front Microbiol. 2015 Oct 29;6:1178. doi: 10.3389/fmicb.2015.01178. eCollection 2015. Front Microbiol. 2015. PMID: 26579087 Free PMC article. Review.
References
-
- Adrião, A., M. Vieira, I. Fernandes, M. Barbosa, M. Sol, R. P. Tenreiro, L. Chambel, B. Barata, I. Zilhao, G. Shama, S. Perni, S. J. Jordan, P. W. Andrew, and M. L. Faleiro. 2008. Marked intra-strain variation in response of Listeria monocytogenes dairy isolates to acid or salt stress and the effect of acid or salt adaptation on adherence to abiotic surfaces. Int. J. Food Microbiol. 123:142-150. - PubMed
-
- Andrews, W. H. 1985. A review of culture methods and their relation to rapid methods for the detection of Salmonella in foods. Food Technol. 39:77-82.
-
- Anonymous. 1997. EN ISO 11290-1. Microbiology of food and animal feeding stuffs. Horizontal method for the detection and enumeration of Listeria monocytogenes. Part 1: detection. International Organization for Standardization, Geneva, Switzerland.
-
- Anonymous. 2005. Commission regulation (EC) no. 2073/2005 of 15 November 2005 on microbiological criteria for foodstuffs. Off. J. Eur. Union L338/1.
Publication types
MeSH terms
Substances
LinkOut - more resources
Full Text Sources
