

Diversity of bacteria in the marine sponge Aplysina fulva in Brazilian coastal waters
- PMID: 19304829
- PMCID: PMC2681663
- DOI: 10.1128/AEM.02101-08
Diversity of bacteria in the marine sponge Aplysina fulva in Brazilian coastal waters
Erratum in
- Appl Environ Microbiol. 2011 Sep;77(18):6737
Abstract
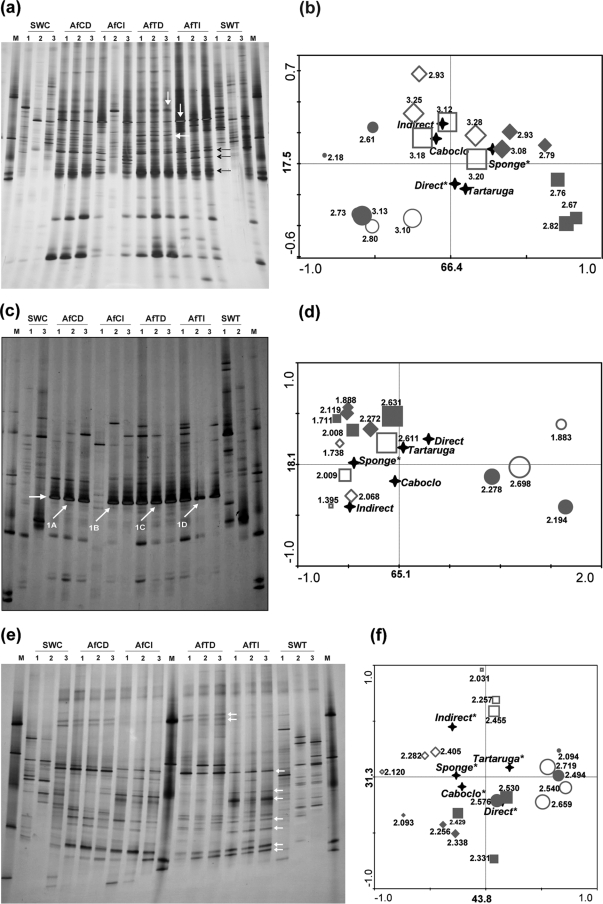
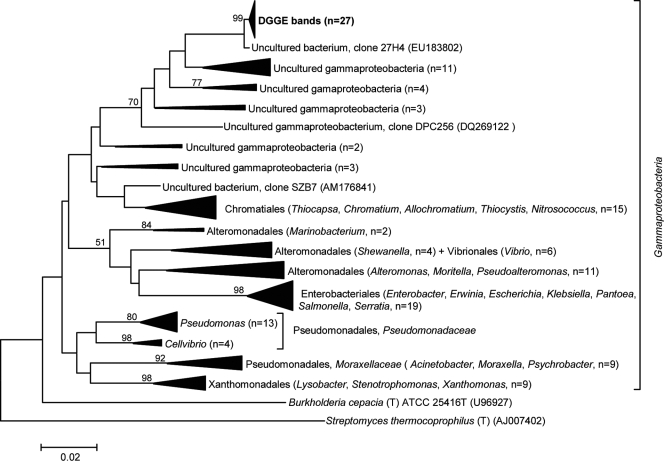
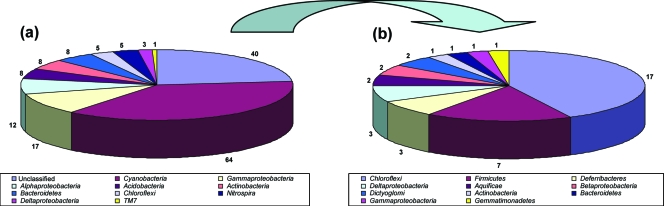
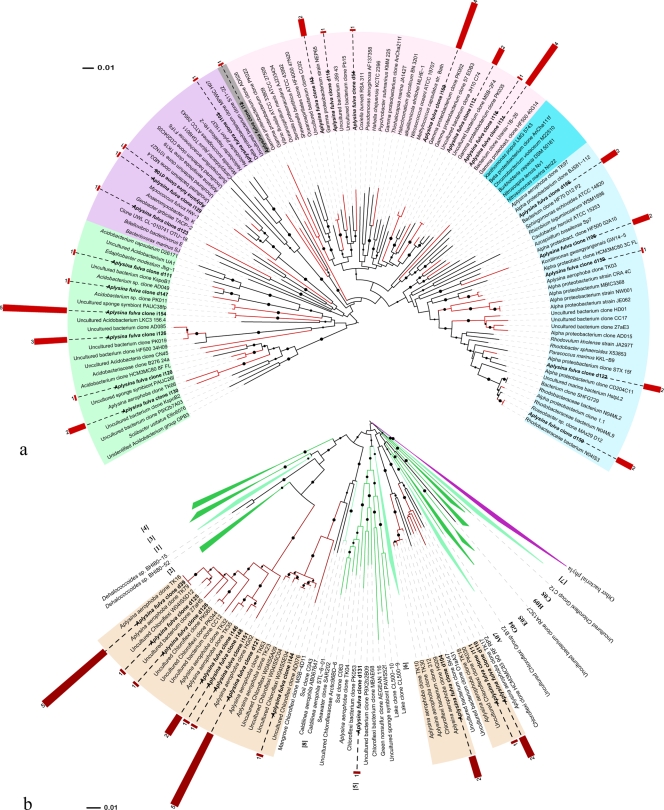
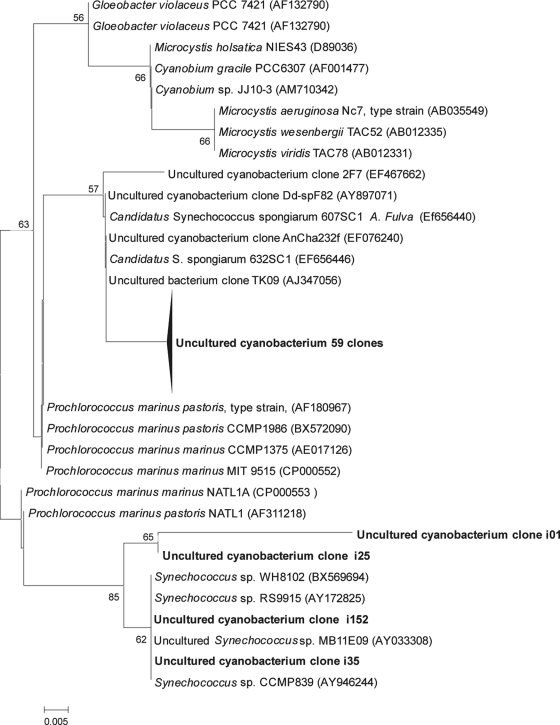
Microorganisms can account for up to 60% of the fresh weight of marine sponges. Marine sponges have been hypothesized to serve as accumulation spots of particular microbial communities, but it is unknown to what extent these communities are directed by the organism or the site or occur randomly. To address this question, we assessed the composition of specific bacterial communities associated with Aplysina fulva, one of the prevalent sponge species inhabiting Brazilian waters. Specimens of A. fulva and surrounding seawater were collected in triplicate in shallow water at two sites, Caboclo Island and Tartaruga beach, Búzios, Brazil. Total community DNA was extracted from the samples using "direct" and "indirect" approaches. 16S rRNA-based PCR-denaturing gradient gel electrophoresis (PCR-DGGE) analyses of the total bacterial community and of specific bacterial groups--Pseudomonas and Actinobacteria--revealed that the structure of these assemblages in A. fulva differed drastically from that observed in seawater. The DNA extraction methodology and sampling site were determinative for the composition of actinobacterial communities in A. fulva. However, no such effects could be gleaned from total bacterial and Pseudomonas PCR-DGGE profiles. Bacterial 16S rRNA gene clone libraries constructed from directly and indirectly extracted DNA did not differ significantly with respect to diversity and composition. Altogether, the libraries encompassed 15 bacterial phyla and the candidate division TM7. Clone sequences affiliated with the Cyanobacteria, Chloroflexi, Gamma- and Alphaproteobacteria, Actinobacteria, Bacteroidetes, and Acidobacteria were, in this order, most abundant. The bacterial communities associated with the A. fulva specimens were distinct and differed from those described in studies of sponge-associated microbiota performed with other sponge species.
Figures
References
-
- Althoff, K., C. Schütt, R. Steffen, R. Batel, and W. E. G. Müller. 1998. Evidence for a symbiosis between bacteria of the genus Rhodobacter and the marine sponge Halichondria panicea: harbor also for putatively toxic bacteria? Mar. Biol. 130:529-536.
-
- Blunt, J. W., B. R. Copp, M. H. G. Munro, P. T. Northcote, and M. R. Prinsep. 2005. Marine natural products. Nat. Prod. Rep. 22:15-61. - PubMed
-
- Brusca, R. C., and G. J. Brusca. 2002. Phylum Porifera: the sponges, p. 179-208. In A. D. Sinauer (ed.), Invertebrates. Sinauer Associates, Inc., Cambridge, MA.
Publication types
MeSH terms
Substances
Associated data
- Actions
- Actions
- Actions
- Actions
- Actions
- Actions
- Actions
- Actions
- Actions
- Actions
- Actions
- Actions
- Actions
- Actions
- Actions
- Actions
- Actions
- Actions
- Actions
- Actions
- Actions
- Actions
- Actions
- Actions
- Actions
- Actions
- Actions
- Actions
- Actions
- Actions
- Actions
- Actions
- Actions
- Actions
- Actions
- Actions
- Actions
- Actions
- Actions
- Actions
- Actions
- Actions
- Actions
- Actions
- Actions
- Actions
- Actions
- Actions
- Actions
- Actions
- Actions
- Actions
- Actions
- Actions
- Actions
- Actions
- Actions
- Actions
- Actions
- Actions
- Actions
- Actions
- Actions
- Actions
- Actions
- Actions
- Actions
- Actions
- Actions
- Actions
- Actions
- Actions
- Actions
- Actions
- Actions
- Actions
- Actions
- Actions
- Actions
- Actions
- Actions
- Actions
- Actions
- Actions
- Actions
- Actions
- Actions
- Actions
- Actions
- Actions
- Actions
- Actions
- Actions
- Actions
- Actions
- Actions
- Actions
- Actions
- Actions
- Actions
- Actions
- Actions
- Actions
- Actions
- Actions
- Actions
- Actions
- Actions
- Actions
- Actions
- Actions
- Actions
- Actions
- Actions
- Actions
- Actions
- Actions
- Actions
- Actions
- Actions
- Actions
- Actions
- Actions
- Actions
- Actions
- Actions
- Actions
- Actions
- Actions
- Actions
- Actions
- Actions
- Actions
- Actions
- Actions
- Actions
- Actions
- Actions
- Actions
- Actions
- Actions
- Actions
- Actions
- Actions
- Actions
- Actions
- Actions
- Actions
- Actions
- Actions
- Actions
- Actions
- Actions
- Actions
- Actions
- Actions
- Actions
- Actions
- Actions
- Actions
- Actions
- Actions
- Actions
- Actions
- Actions
- Actions
- Actions
- Actions
- Actions
- Actions
- Actions
- Actions
- Actions
- Actions
- Actions
- Actions
- Actions
- Actions
- Actions
- Actions
- Actions
- Actions
- Actions
- Actions
- Actions
- Actions
- Actions
- Actions
- Actions
- Actions
- Actions
- Actions
- Actions
- Actions
- Actions
- Actions
- Actions
- Actions
LinkOut - more resources
Full Text Sources
Molecular Biology Databases
