Clinical Trial
. 2009 Jun;296(6):L987-93.
doi: 10.1152/ajplung.90512.2008. Epub 2009 Mar 20.

Mass spectrometric analysis of biomarkers and dilution markers in exhaled breath condensate reveals elevated purines in asthma and cystic fibrosis

Affiliations
Clinical Trial

Mass spectrometric analysis of biomarkers and dilution markers in exhaled breath condensate reveals elevated purines in asthma and cystic fibrosis

Charles R Esther Jr et al. Am J Physiol Lung Cell Mol Physiol. 2009 Jun.

Abstract

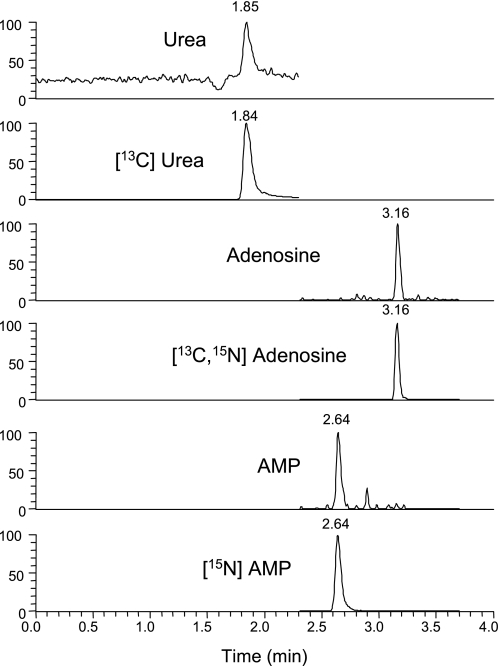
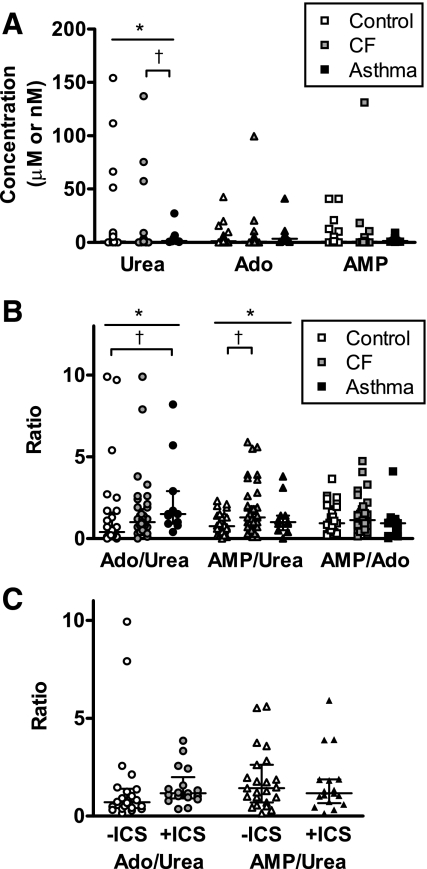
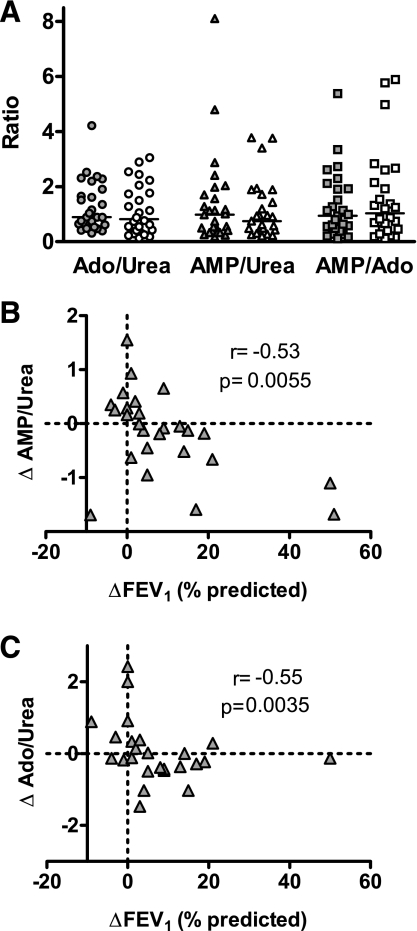
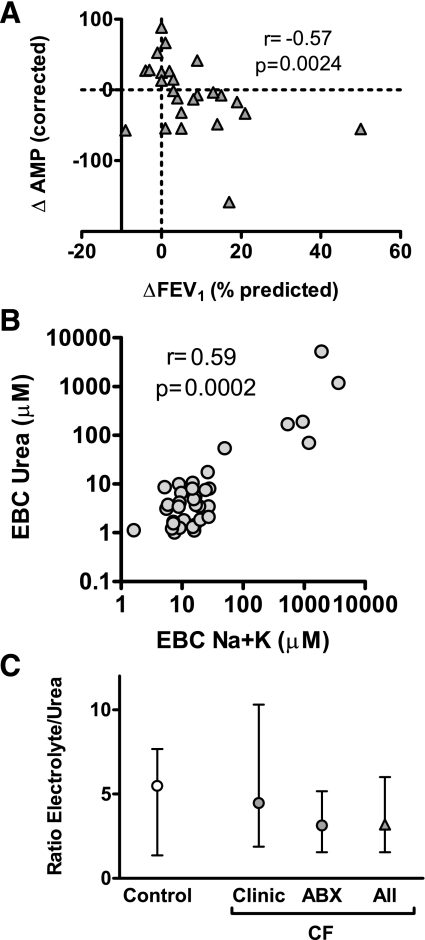
Exhaled breath condensate (EBC) analyses promise simple and noninvasive methods to measure airway biomarkers but pose considerable methodological challenges. We utilized mass spectrometry to measure EBC purine biomarkers adenosine and AMP plus urea to control for dilutional variability in two studies: 1) a cross-sectional analysis of 28 healthy, 40 cystic fibrosis (CF), and 11 asthmatic children; and 2) a longitudinal analysis of 26 CF children before and after treatment of a pulmonary exacerbation. EBC adenosine, AMP, and urea were readily detected and quantified by mass spectrometry, and analysis suggested significant dilutional variability. Using biomarker-to-urea ratios to control for dilution, the EBC AMP-to-urea ratio was elevated in CF [median 1.3, interquartile range (IQR) 0.7-2.3] vs. control (median 0.75, IQR 0.3-1.4; P < 0.05), and the adenosine-to-urea ratio was elevated in asthma (median 1.5, IQR 0.9-2.9) vs. control (median 0.4, IQR 0.2-1.6; P < 0.05). Changes in EBC purine-to-urea ratios correlated with changes in percent predicted forced expiratory volume in 1 s (FEV(1)) (r = -0.53 AMP/urea, r = -0.55 adenosine/urea; P < 0.01 for both) after CF exacerbation treatment. Similar results were observed using dilution factors calculated from serum-to-EBC urea ratios or EBC electrolytes, and the comparable ratios of EBC electrolytes to urea in CF and control (median 3.2, IQR 1.6-6.0 CF; median 5.5, IQR 1.4-7.7 control) validated use of airway urea as an EBC dilution marker. These results show that mass spectrometric analyses can be applied to measurement of purines in EBC and demonstrate that EBC adenosine-to-urea and AMP-to-urea ratios are potential noninvasive biomarkers of airways disease.


Figures

Fig. 1.
Fig. 1.
Detection of urea, adenosine, and AMP in exhaled breath condensate (EBC) by liquid chromatography-tandem mass spectrometry (LC-MS/MS). EBC samples were analyzed using a previously described LC-MS/MS method (10). A sample chromatogram from an EBC collected from a cystic fibrosis (CF) subject is shown, demonstrating specific detection of urea, adenosine, AMP, and their stable isotopically labeled internal standards.
Fig. 2.
Fig. 2.
EBC purines are elevated in children with CF after controlling for dilution. A: concentrations of EBC urea, adenosine (Ado), and AMP were measured by LC-MS/MS from control (n = 28, white symbols), CF (n = 40, gray symbols), and asthmatic (n = 11, black symbols) children. The wide range of urea values suggested significant dilutional variability. Posttest analysis revealed significant differences between CF and asthma urea concentrations, although interpretation is limited by the relatively small number of subjects in the asthma group. Measured values after lyophilization are reported; native EBC values would be 20-fold lower. Reported concentrations are micromolar for urea and nanomolar for purines. B: analysis of ratios of EBC urea, adenosine, and AMP (nanomolar purine to micromolar urea) to control for dilution revealed within group differences in adenosine-to-urea and AMP-to-urea ratios. Posttest analyses showed that EBC adenosine-to-urea ratio was elevated in both asthma relative to control and that EBC AMP-to-urea ratio was elevated in CF relative to control. *P < 0.05 for group by 1-way ANOVA, †P < 0.05 vs. control by Dunn's multiple comparison test. C: subgroup analyses of the CF subjects treated with inhaled corticosteroids (ICS+, n = 16) or not treated with ICS (ICS−, n = 22). The adenosine-to-urea ratios were higher in subjects receiving ICS relative to healthy controls (P < 0.05) and exhibited a trend toward statistical significance relative to CF subjects not treated with ICS (P = 0.08). The AMP-to-urea ratios were similar in both ICS-treated and untreated CF groups, and this ratio remained elevated relative to control after exclusion of CF subjects treated with ICS (P < 0.02). Two subjects receiving oral corticosteroids were excluded from this analysis. All data are shown as medians ± interquartile range (IQR).
Fig. 3.
Fig. 3.
EBC purine ratios decrease after treatment of a CF exacerbation and correlate with changes in lung function. A: levels of urea, adenosine, and AMP were measured by LC-MS/MS in EBC collected at the start (gray symbols) and end (white symbols) of treatment of a CF pulmonary exacerbation with intravenous antibiotics (n = 26). No change in any ratio was observed (P values: 0.275 adenosine/urea, 0.622 AMP/urea, 0.809 AMP/adenosine). B: further analysis revealed a statistically significant negative correlation between change in lung function [percent predicted forced expiratory volume in 1 s (FEV1)] and change in the AMP-to-urea ratio, suggesting that decreases in the AMP-to-urea biomarker are relative to efficacy of treatment. C: similar correlations were observed between lung function and changes in the adenosine-to-urea ratio.
Fig. 4.
Fig. 4.
Alternate methods to control for EBC dilution. A: airway concentrations of adenosine and AMP values in the CF exacerbation group were estimated using serum and EBC urea values to calculate a dilution factor for airway secretions with EBC. Corrected AMP levels remained significantly correlated with changes in lung function (n = 25). B: EBC electrolytes (sodium plus potassium) were measured as an alternative dilution marker in 35 samples from control subjects (n = 9), CF subjects during the cross-sectional study (n = 8), and CF subjects during CF exacerbation study (n = 18). A significant correlation between EBC electrolytes (Na+K) and EBC urea was observed, suggesting that both urea and electrolytes were functioning as dilution markers. C: the ratio of electrolytes to urea measured in EBC from control subjects was similar to the ratio measured in EBC from CF subjects enrolled from the cross-sectional (Clinic), the CF exacerbation (ABX), and in all CF values combined (All), suggesting that airway urea levels are not significantly altered by CF lung disease.

Similar articles

Cited by

References

    1. Balfour-Lynn IM Asthma in cystic fibrosis. J R Soc Med 96, Suppl 43: 30–34, 2003. - PMC - PubMed
    1. Bloemen K, Lissens G, Desager K, Schoeters G. Determinants of variability of protein content, volume and pH of exhaled breath condensate. Respir Med 101: 1331–1337, 2007. - PubMed
    1. Bodini A, D'Orazio C, Peroni D, Corradi M, Folesani G, Baraldi E, Assael BM, Boner A, Piacentini GL. Biomarkers of neutrophilic inflammation in exhaled air of cystic fibrosis children with bacterial airway infections. Pediatr Pulmonol 40: 494–499, 2005. - PubMed
    1. Burnstock G Pathophysiology and therapeutic potential of purinergic signaling. Pharmacol Rev 58: 58–86, 2006. - PubMed
    1. Chen Y, Corriden R, Inoue Y, Yip L, Hashiguchi N, Zinkernagel A, Nizet V, Insel PA, Junger WG. ATP release guides neutrophil chemotaxis via P2Y2 and A3 receptors. Science 314: 1792–1795, 2006. - PubMed

Publication types

MeSH terms