. 2009 Apr 15;8(8):1256-70.
doi: 10.4161/cc.8.8.8287. Epub 2009 Apr 23.

A molecular mechanism of chronological aging in yeast

Affiliations

A molecular mechanism of chronological aging in yeast

Christopher R Burtner et al. Cell Cycle. .

Abstract

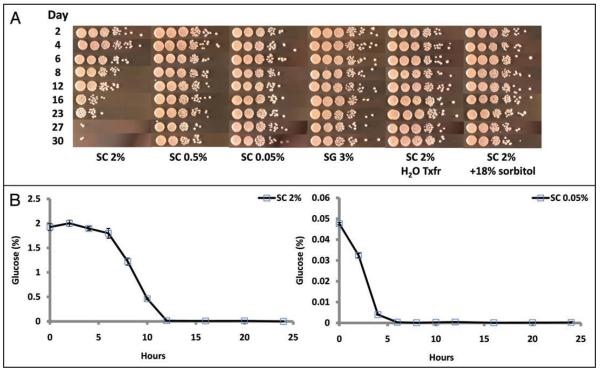
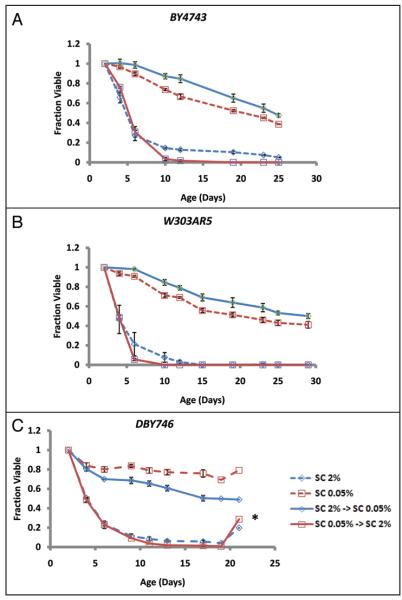
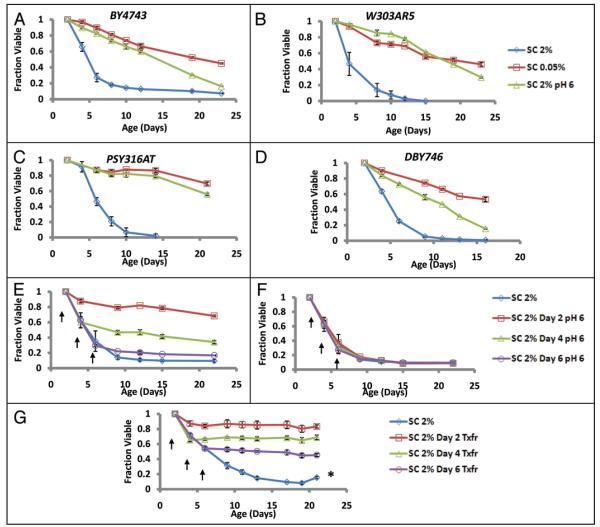
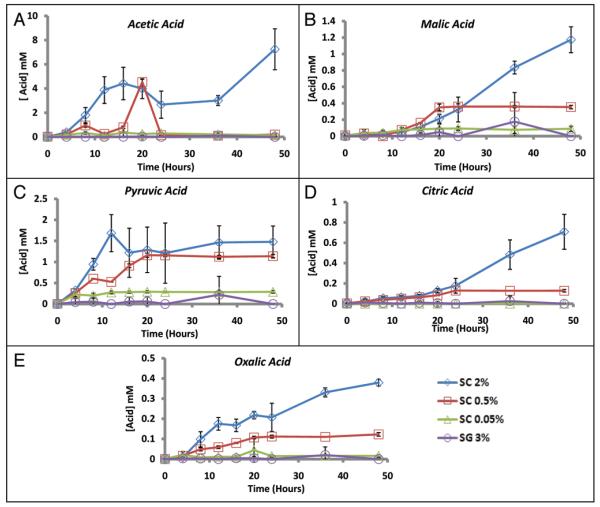
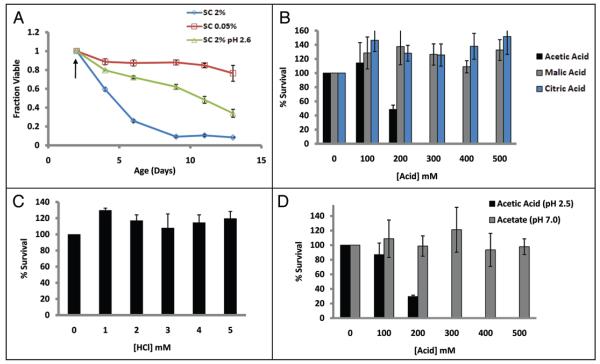
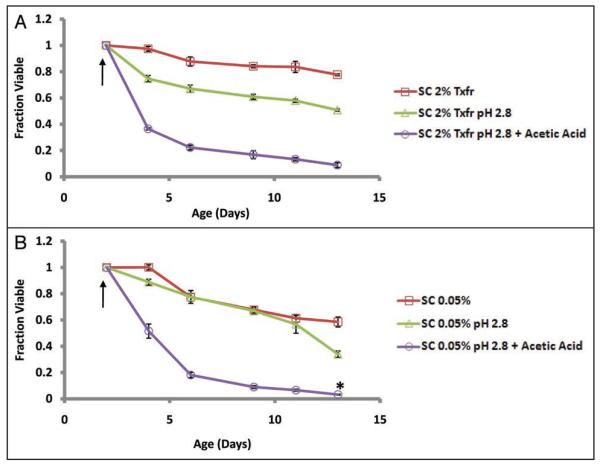
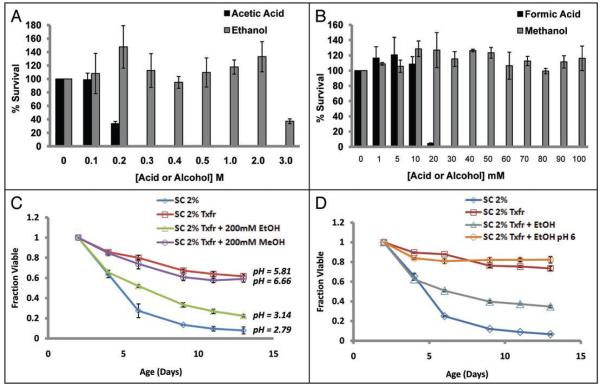
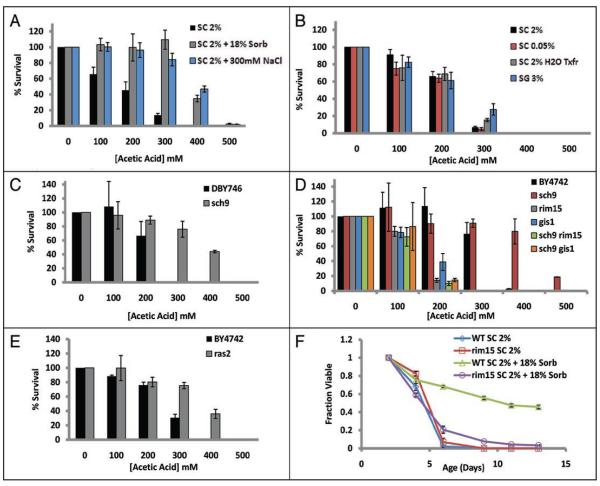
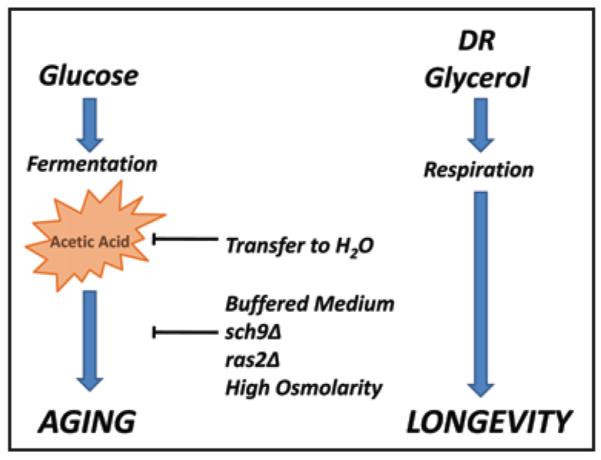
The molecular mechanisms that cause organismal aging are a topic of intense scrutiny and debate. Dietary restriction extends the life span of many organisms, including yeast, and efforts are underway to understand the biochemical and genetic pathways that regulate this life span extension in model organisms. Here we describe the mechanism by which dietary restriction extends yeast chronological life span, defined as the length of time stationary yeast cells remain viable in a quiescent state. We find that aging under standard culture conditions is the result of a cell-extrinsic component that is linked to the pH of the culture medium. We identify acetic acid as a cell-extrinsic mediator of cell death during chronological aging, and demonstrate that dietary restriction, growth in a non-fermentable carbon source, or transferring cells to water increases chronological life span by reducing or eliminating extracellular acetic acid. Other life span extending environmental and genetic interventions, such as growth in high osmolarity media, deletion of SCH9 or RAS2, increase cellular resistance to acetic acid. We conclude that acetic acid induced mortality is the primary mechanism of chronological aging in yeast under standard conditions.


Figures

Figure 1
Figure 1
Growth medium conditions that extend chronological life span. (A) Relative to growth in SC 2%, reducing the glucose present in the medium, use of glycerol as the carbon source, transfer to water, or addition of sorbitol increases cell survival. On the indicated days, the aging culture was serially diluted ten-fold in rich YPD medium, and 5 ul of each dilution was spotted onto YPD agar plates and incubated for 48 hours at 30°C. A single representative biological experiment for each condition is depicted; triplicate biological replicates were performed. SC 2%, SC 0.5% and SC 0.05% = synthetic complete medium at the indicated glucose concentration; SG 3% = synthetic complete 3% glycerol; SC 2% H2O Txfr = SC 2% cells washed and transferred to distilled water at day 2; SC 2% + 18% sorbitol = SC 2% supplemented with 18% sorbitol. (B) Glucose is depleted in logarithmically growing cultures. The diploid strain BY4743 was grown overnight in YPD, and back-diluted 1:100 (starting density = ∼1.4 × 10⁶ cells/ml) in SC 2% or SC 0.05% medium. Error bars are standard deviation of biological duplicates.
Figure 2
Figure 2
Chronological aging is caused by a cell-extrinsic factor. (A) BY4743, (B) W303AR5 or (C) DBY476 were grown in SC 2% or SC 0.05% medium for 2 days then resuspended in supernatant from isogenic cells grown in either in SC 2% or SC 0.05% medium for 2 days. In each case, cells grown for 2 days in SC 2% then transferred to cell free pre-conditioned medium from 2 day old SC 0.05% yeast (SC 2% → SC 0.05%) lived significantly longer than cells maintained in SC 2% medium (SC 2%). Cells grown for 2 days in SC 0.05% then transferred to cell free pre-conditioned medium from 2 day old SC 2% yeast (SC 0.05% → SC 2%) lived significantly shorter than cells maintained in SC 0.05% medium. The asterisk in (C) indicates culture re-growth, a phenomenon known as gasping that is observed in chronologically aging cultures when a small fraction of the population re-enters the cell cycle. Error bars are standard deviation of three biological replicates.
Figure 3
Figure 3
Buffering the aging culture at pH 6 extends CLS. Yeast strains (A) BY4743, (B) W303AR5, (C) PSY316AT or (D) DBY746 were inoculated into SC 2%, SC 0.05%, or SC 2% supplemented with a citrate phosphate buffer at pH 6.0 (SC 2% pH 6, see Materials and Methods). Buffering the SC 2% medium increased CLS to an extent similar to DR. Error bars indicate the standard deviation of three biological replicates. (E) Addition of a pH 6.0 citrate phosphate buffer in SC at day 2, day 4, or day 6 of chronological age is sufficient to increase CLS, relative to (F) cells treated with an equal volume of unbuffered basic medium. (G) Transfer of cells from the aging culture to water at day 2, day 4 or day 6 also significantly increases CLS. The asterisk in (G) indicates gasping (see Fig. Legend 2). Arrows indicate age at treatments. Error bars indicate the standard deviation of three biological replicates.
Figure 4
Figure 4
Quantification of organic acid production during chronological aging. Organic acids were quantified by HPLC at the indicated age-points for yeast cells grown in SC 2%, SC 0.5%, SC 0.05% or SG 3%. Quantification was performed for (A) acetic, (B) malic, (C) pyruvic, (D) citric and (E) oxalic acids. The two peaks observed in the acetic acid profile were reproducible across multiple biological replicates and independent experiments and verified using an enzymatic acetic acid assay (Boehringer Mannheim, see Materials and Methods, and data not shown). Error bars indicate standard deviation of biological replicates (n = 4 for SC 2C%, SC 0.05% and SG 3%; n = 2 for SC 0.5%).
Figure 5
Figure 5
Acetic acid is specifically toxic to yeast cells. (A) BY4743 cells were aged in SC 2%, SC 0.05%, or pre-grown for 48 hours in SC 0.05% then buffered to pH 2.6 with the addition of a concentrated buffer (see Materials and Methods). Arrow indicates age at buffer addition. Error bars indicate the standard deviation of three biological replicates. (B) Acetic acid significantly reduced survival of 4 day old yeast cells cultured in SC 2%, but neither malic nor citric acid had a similar effect, even though the pH was similar in each case (Table S1). (C) Addition of hydrochloric acid at a concentration sufficient to decrease pH to a level comparable to 500 mM acetic acid did not reduce survival of 4 day old yeast cells. (D) Only acetic acid (pH 2.5) and not the conjugate base (pH 6.0) caused cell death in BY4742 cells. Error bars indicate standard deviation of three technical replicates.
Figure 6
Figure 6
Acetic acid is sufficient to cause chronological aging. (A) 2-day old BY4743 cultures were transferred to water adjusted to pH 2.8 with HCl and maintained at a concentration of 10 mM acetic acid. Acetic acid concentration was monitored every 1–2 hrs for the first 36 hours and additional acetic acid was provided as needed to maintain a concentration of 10 mM (see Suppl. Fig. S8A). The total molar amount of acetic acid added was 108.6 mM. (B) 2-day old BY4743 cultures grown in SC 0.05% were first lowered to pH 2.8 with HCl and then supplemented with 10 mM acetic acid. Acid was monitored similarly as (A) and added as needed over the first 36 hours (see Suppl. Fig. S8B). Mortality curve for SC 0.05% pH 2.8 + acetic acid was normalized for culture growth observed during the course of adding the acid (see Suppl. Fig. S8C) by dividing the viability by the ratio of culture ODs (pH 2.8 + acetic acid/pH 2.8 alone). Error bars indicate the standard deviation of 3 biological replicates for untreated and pH 2.8 cultures, and 6 biological replicates of pH 2.8 cultures maintained at 10 mM acetic acid.
Figure 7
Figure 7
Metabolism of ethanol to acetic acid. (A and B) Stationary phase Saccharomyces are more resistant to the ethanol and methanol than to the corresponding metabolic acid by-products, acetic acid and formic acid acidic. (C) 2-day old cultures transferred to water containing 200 mM ethanol have a shorter CLS than cultures transferred to methanol-containing water, and a concomitant acidification of the culture medium only occurs in cells receiving ethanol. (D) The short CLS of ethanol treated cultures can be rescued by buffering the culture medium to pH 6. Error bars indicate the standard deviation of three biological replicates.
Figure 8
Figure 8
High osmolarity, deletion of SCH9, or deletion of RAS2 increase CLS by enhancing resistance to acetic acid. (A) Four day old BY4743 cells grown in SC 2% supplemented with 18% sorbitol are significantly more resistant to acetic acid, compared to control cells. (B) Growth in reduced glucose medium, growth in 3% glycerol, or transfer to water does not significantly increase resistance to acetate. Deletion of SCH9 increases resistance to acetic acid in (C) DBY746 and (D) BY4742 cells. Acetic acid resistance associated with deletion of SCH9 requires both Rim15 and Gis1. (E) BY4742 ras2Δ cells are resistant to acetic acid, relative to parental wild type cells. (F) CLS life span extension by growth in high osmolarity is dependent upon the protein kinase RIM15. Error bars indicate the standard deviation of three technical replicates.
Figure 9
Figure 9
Model for acetic acid as a cause of chronological aging in yeast. Chronological life span can be increased by either (1) increasing cellular resistance to acetic acid produced as a by-product of fermentative metabolism or (2) by reducing the amount of acetic acid produced via a shift toward respiratory metabolism. This model explains many known modifiers of CLS.

Comment in

References

    1. Harman D. Aging: a theory based on free radical and radiation chemistry. J Gerontol. 1956;11:298–300. - PubMed
    1. Harley CB, Vaziri H, Counter CM, Allsopp RC. The telomere hypothesis of cellular aging. Exp Gerontol. 1992;27:375–82. - PubMed
    1. Campisi J. Senescent cells, tumor suppression and organismal aging: good citizens, bad neighbors. Cell. 2005;120:513–22. - PubMed
    1. Dolle ME, Vijg J. Genome dynamics in aging mice. Genome Res. 2002;12:1732–8. - PMC - PubMed
    1. Wallenfang MR, Nayak R, DiNardo S. Dynamics of the male germline stem cell population during aging of Drosophila melanogaster. Aging Cell. 2006;5:297–304. - PubMed

Publication types