

Bias, randomization, and ovarian proteomic data: a reply to "producers and consumers"
- PMID: 19305627
- PMCID: PMC2657654
Bias, randomization, and ovarian proteomic data: a reply to "producers and consumers"
Abstract
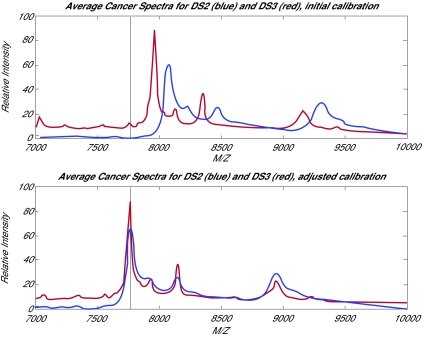
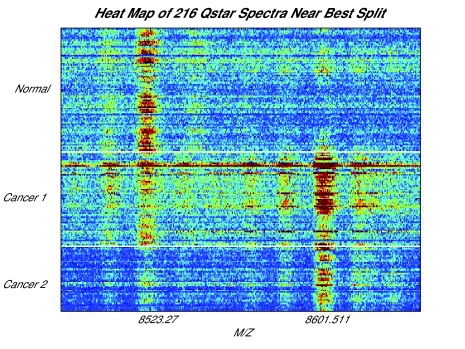
Proteomic patterns derived from mass spectrometry have recently been put forth as potential biomarkers for the early diagnosis of cancer. This approach has generated much excitement, particularly as initial results reported on SELDI profiling of serum suggested that near perfect sensitivity and specificity could be achieved in diagnosing ovarian cancer. However, more recent reports have suggested that much of the observed structure could be due to the presence of experimental bias. A rebuttal to the findings of bias, subtitled "Producers and Consumers", lists several objections. In this paper, we attempt to address these objections. While we continue to find evidence of experimental bias, we emphasize that the problems found are associated with experimental design and processing, and can be avoided in future studies.
Keywords: calibration; experimental design; mass spectrometry; proteomics; serum profiling.
Figures
References
-
- Alexe Gabriela, Alexe Sorin, Liotta Lance A, Petricoin Emmanuel, Reiss Michael, Hammer Peter L. Ovarian cancer detection by logical analysis of proteomic data. Proteomics. 2004;4:766–783. - PubMed
-
- Baggerly Keith A, Morris Jeffrey S, Coombes Kevin R. Reproducibility of SELDI-TOF Protein Patterns in Serum: Comparing Data Sets from Different Experiments. Bioinformatics. 2004a;20:777–785. - PubMed
-
- Baggerly Keith A, Edmonson Sarah R, Morris Jeffrey S, Coombes Kevin R. High-resolution serum proteomic patterns for ovarian cancer detection. Endocrine-Related Cancer. 2004b;11(4):583–584. - PubMed
-
- Baggerly Keith A, Morris Jeffrey S, Edmonson Sarah R, Coombes Kevin R. Signal in Noise: Evaluating Reported Reproducibility of Serum Proteomic Tests for Ovarian Cancer. J Natl Cancer Inst. 2005;97(4):307–309. - PubMed
-
- Brazma A, Hingamp P, Quackenbush J, Sherlock G, Spellman P, Stoeckert C, Aach J, Ansorge W, Ball CA, Causton HC, Gaasterland T, Glenisson P, Holstege FC, Kim IF, Markowitz V, Matese JC, Parkinson H, Robinson A, Sarkans U, Schulze-Kremer S, Stewart J, Taylor R, Vilo J, Vingron M. Minimum information about a microarray experiment (MIAME)-toward standards for microarray data. Nat Genet. 2001;29:365–71. - PubMed
Grants and funding
LinkOut - more resources
Full Text Sources