. 2005;1(1):86-97.

the need for review and understanding of SELDI/MALDI mass spectroscopy data prior to analysis

Affiliations

the need for review and understanding of SELDI/MALDI mass spectroscopy data prior to analysis

William E Grizzle et al. Cancer Inform. 2005.

Abstract

Multiple studies have reported that surface enhanced laser desorption/ionization time of flight mass spectroscopy (SELDI-TOF-MS) is useful in the early detection of disease based on the analysis of bodily fluids. Use of any multiplex mass spectroscopy based approach as in the analysis of bodily fluids to detect disease must be analyzed with great care due to the susceptibility of multiplex and mass spectroscopy methods to biases introduced via experimental design, patient samples, and/or methodology. Specific biases include those related to experimental design, patients, samples, protein chips, chip reader and spectral analysis. Contributions to biases based on patients include demographics (e.g., age, race, ethnicity, sex), homeostasis (e.g., fasting, medications, stress, time of sampling), and site of analysis (hospital, clinic, other). Biases in samples include conditions of sampling (type of sample container, time of processing, time to storage), conditions of storage, (time and temperature of storage), and prior sample manipulation (freeze thaw cycles). Also, there are many potential biases in methodology which can be avoided by careful experimental design including ensuring that cases and controls are analyzed randomly. All the above forms of biases affect any system based on analyzing multiple analytes and especially all mass spectroscopy based methods, not just SELDI-TOF-MS. Also, all current mass spectroscopy systems have relatively low sensitivity compared with immunoassays (e.g., ELISA). There are several problems which may be unique to the SELDI-TOF-MS system marketed by Ciphergen(®). Of these, the most important is a relatively low resolution (±0.2%) of the bundled mass spectrometer which may cause problems with analysis of data. Foremost, this low resolution results in difficulties in determining what constitutes a "peak" if a peak matching approach is used in analysis. Also, once peaks are selected, the peaks may represent multiple proteins. In addition, because peaks may vary slightly in location due to instrumental drift, long term identification of the same peaks may prove to be a challenge. Finally, the Ciphergen(®) system has some "noise" of the baseline which results from the accumulation of charge in the detector system. Thus, we must be very aware of the factors that may affect the use of proteomics in the early detection of disease, in determining aggressive subsets of cancers, in risk assessment and in monitoring the effectiveness of novel therapies.

Keywords: bias; cancer detection; mass spectrometry; serum; specimen processing; specimens.


Figures

Figure 1
Figure 1
Figure 1 demonstrates the spectral decreases upon multiple laser shots in same area. The same sample was applied to spots A, B, and C and these spots were analyzed initially with 5 laser shots per spot to demonstrate consistency of spectral pattern. Following 3 additional samplings of spot B, at 5 laser shots each at the same site, the decrease in the spectrum is clear (4th 5 shot read of spot B). After a total of 10 and 14 5 shot samplings at the same site on spot B, a marked decline in sample intensity was noted (10th read of spot B and 14th read of spot B respectively).
Figure 2
Figure 2
Figure 2 demonstrates that molecular markers in bodily fluids that may be used in the diagnosis of cancers may come from multiple sources. The tumor itself may produce markers such as CEA (colorectal cancer) that are produced by the tumor. Other tumor products may circulate and induce changes in distant tissues (e.g. liver and kidney) affecting the synthesis or metabolism of specific molecules. The stromal and inflammatory response to the tumor may also modulate proteins (e.g, cytokines) in serum.
Figure 3
Figure 3
Figure 3 emphasizes that some markers such as oncofetal tumor molecules are produced directly by the tumor while other tissue specific molecules such as PSA may be produced by the uninvolved tissues in addition to the tumor. Patterns of all proteins in bodily fluids depend upon multiple factors including where the contents of dying cells are dumped as well as the rate of cellular death.
Figure 4
Figure 4
Figure 4 demonstrates two types of peaks observed in spectra when comparing cases with controls. The molecular features of the control lower spectrum demonstrates three peaks. These would usually be seen in any patient without disease. In the spectrum of the diseased patient, a new peak (primary peak) is present in the spectrum. This would probably result from a product produced because of the disease. Of interest, a peak (secondary peak) present in the spectra of most patients without disease is now absent from the spectrum of the diseased patient. Such peaks are not understood but may represent tumor-normal organ cross talk to reduce production of a protein or the production of an enzyme by the diseased state which metabolizes the protein of the secondary peak.
Figure 5
Figure 5
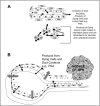
Figure 5A is a cartoon which suggests how the secretions of living cells and the contents of dying cells of normal prostatic glands may exit the body without being absorbed into the vascular system. In contrast, dying cells of prostate cancer dump their contents into the interstitutium and these products are likely to be absorbed into the vascular system. Figure 5B demonstrates that as benign prostatic hyperplasia develops that glandular contents may be blocked from the usual pathway. Subsequently the glands may become dilated and/or inflamed and contents including PSA may leak from the lumen of the gland into the interstitial space.
Figure 6
Figure 6
The bar graph of figure 6 demonstrates the decline in the peaks of three unidentified proteins in serum that follow multiple freeze thaw cycles of samples of serum. The pattern of decline varies with specific peaks; however, most peaks do not decline greatly until after at least three freeze thaw cycles.
Figure 7
Figure 7
Figure 7 demonstrates that storage of aliquots of a sample at −20°C (non-self defrost) for more than 6 months results in changes in peak amplitudes (A) and peak amplitude ratios (B vs C). Such changes were not noted on storage of an aliquot from the same original specimen for 10 months at −80°C.
Figure 8
Figure 8
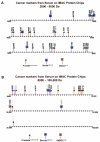
The spectra in Figure 8A (titled “Cancer markers from Serum on IMAC Protein Chips 2000 – 8000 Da”) and 8B (titled “Cancer markers from Serum on IMAC Protein Chips 8000 – 100,000 Da”) demonstrate some of the informative spectral peaks (e.g. peak locations) reported in the literature for the early detection of prostate, breast and head and neck tumors as detected using serum samples on IMAC copper activated protein chips.
Figure 9
Figure 9
Figure 9A is depicts cancer markers from various chip types, 0 to 4000 Da. Figure 9B depicts cancer markers from various chip types 4000 to 8000 Da. Figure 9C depicts cancer markers from various chip types 8000 to 20,000 Da. Figure 9D depicts cancer markers from various chip types 20,000 to 100,000 Da. The spectra in Figure 9A–D demonstrate the informative spectral peaks (e.g., peak locations) reported in the literature (except those of Figure 8) for the detection of neoplasias in multiple organ systems using multiple samples and various types of protein chips.

References

    1. Adam BL, Qu Y, Davis JW, Ward MD, Clements MA, Cazares LH, Semmes OJ, Schellhammer PF, Yasui Y, Feng Z, Wright GL., Jr Serum protein fingerprinting coupled with a pattern-matching algorithm distinguishes prostate cancer from benign prostate hyperplasia and healthy men. Cancer Res. 2002;62(13):3609–3614. (#12) - PubMed
    1. Ball G, Mian S, Holding F, Allibone RO, Lowe J, Ali S, Li G, McCardle S, Ellis IO, Creaser C, Rees RC. An integrated approach utilizing artificial neural networks and SELDI mass spectrometry for the classification of human tumoours and rapid identification of potential biomarkers. Bioinformatics. 2002;18:395–404. (#36) - PubMed
    1. Banez LL, Prasanna P, Sun L, Ali A, Zou A, Adam L, McLeod DG, Moul JW, Srivastava S. Diagnostic potential of serum proteomic patterns in prostate cancer. J Urol. 2003;170:442–446. (#14) - PubMed
    1. Carter D, Douglass JF, Cornellison CD, Retter MW, Johnson JC, Bennington AA, Fleming TP, Reed SG, Houghton RL, Diamond DL, Vedvick TS. Purification and characterization of the mammaglobin/lipophilin B complex, a promising diagnostic marker for breast cancer. Biochemistry. 2002;41:6714–6722. (#30) - PubMed
    1. Cazares LH, Adam BL, Ward MD, Nasim S, Schellhammer PF, Semmes OJ, Wright GL., Jr Normal, benign, preneoplastic, and malignant prostate cells have distinct protein expression profiles resolved by surface enhanced laser desorption/ionization mass spectrometry. Clin Cancer Res. 2002;8:2541–2552. (#28) - PubMed

LinkOut - more resources