

Comparative Study
doi: 10.1257/jep.22.4.27.
Is American health care uniquely inefficient?
Affiliations
- PMID: 19305645
- PMCID: PMC2659297
- DOI: 10.1257/jep.22.4.27
Item in Clipboard
Comparative Study
Is American health care uniquely inefficient?
J Econ Perspect.
2008 Fall.
No abstract available
Figures
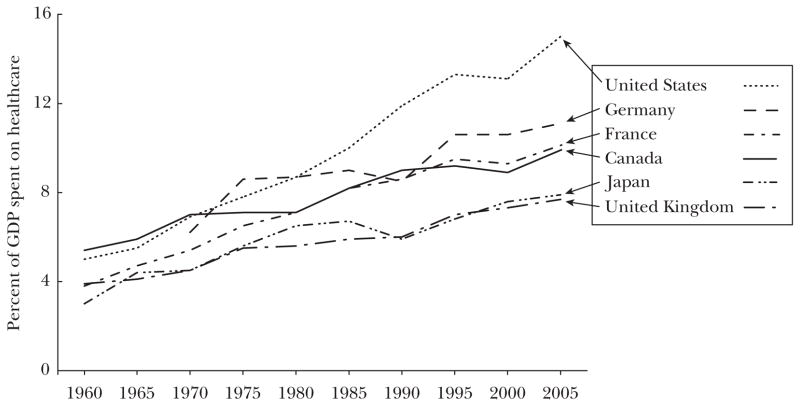
Sources:Chandra and Skinner (2008); OECD (2008). Notes: Data for Germany refer to West Germany. Data for 2005 are estimates based on actual expenditures through 2004.
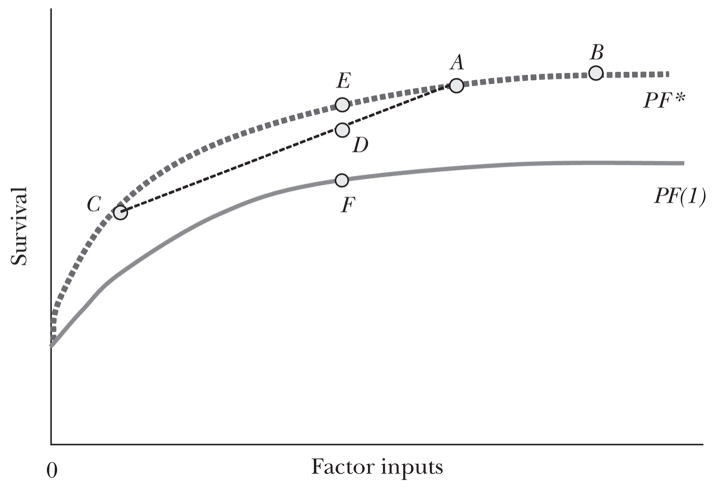
Figure 2a A Health Care Production Function Figure 2b Explaining “Flat of the Curve” Health Care Expenditures
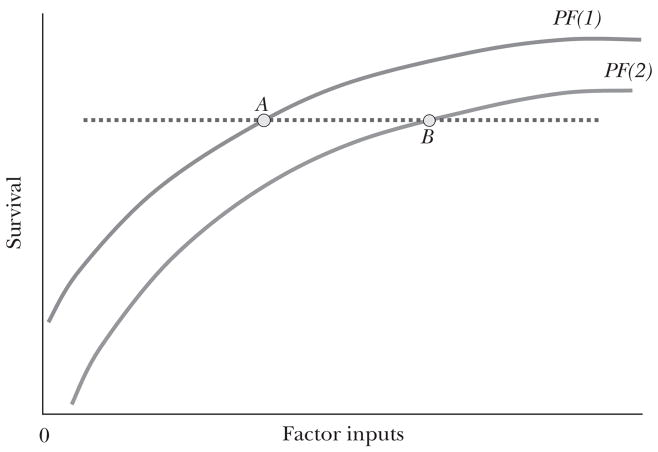
Figure 2a A Health Care Production Function Figure 2b Explaining “Flat of the Curve” Health Care Expenditures
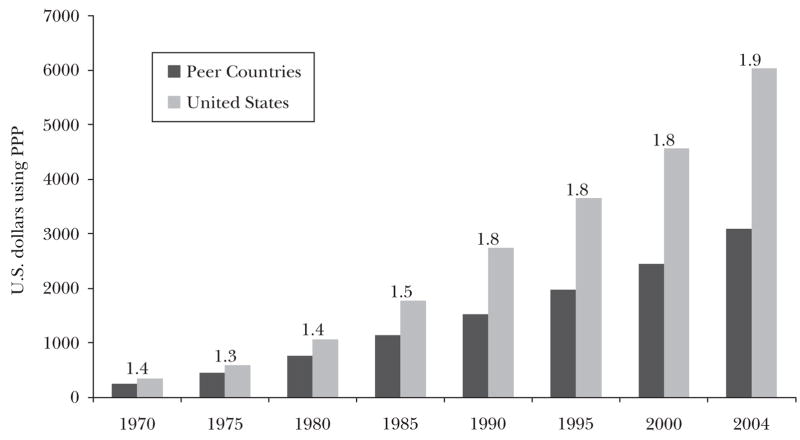
Figure 4a Per Capita Health Care Spending in the U.S. and Peer Countries: 1970–2004 Source:OCED (2008). Note: “Peer countries” include Canada, France, Germany, Japan, Switzerland, and the United Kingdom. Ratio of U.S. to peer country spending written above bars. “PPP” is purchasing power parity. Figure 4b Relative Life Expectancy at Birth in the U.S. and Peer Countries: 1970–2004 Source: OECD (2008). Note: “Peer countries” include Canada, France, Germany, Japan, Switzerland, and the United Kingdom. Ratio of U.S. to Peer Country life expectancy written above bars.
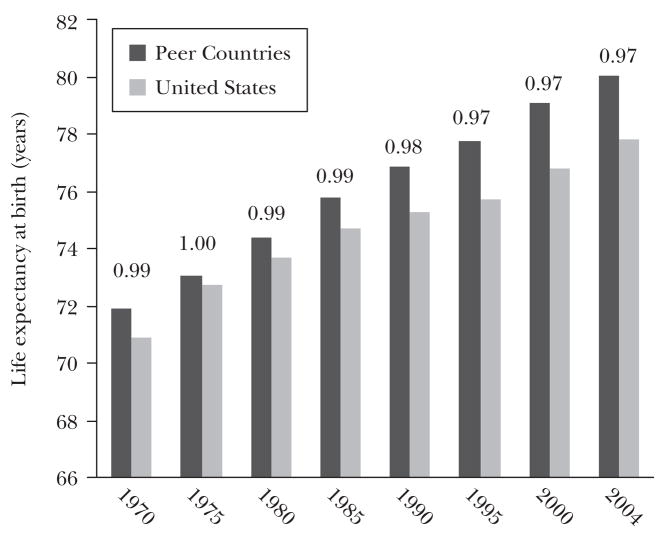
Figure 4a Per Capita Health Care Spending in the U.S. and Peer Countries: 1970–2004 Source:OCED (2008). Note: “Peer countries” include Canada, France, Germany, Japan, Switzerland, and the United Kingdom. Ratio of U.S. to peer country spending written above bars. “PPP” is purchasing power parity. Figure 4b Relative Life Expectancy at Birth in the U.S. and Peer Countries: 1970–2004 Source: OECD (2008). Note: “Peer countries” include Canada, France, Germany, Japan, Switzerland, and the United Kingdom. Ratio of U.S. to Peer Country life expectancy written above bars.
References
-
- Aaron Henry J. The Costs of Health Care Administration in the U.S. and Canada—Questionable Answers to a Questionable Question. New England Journal of Medicine. 2003;349(8):801–3. - PubMed
-
- American College of Physicians (ACP) Achieving a High-Performance Health Care System with Universal Access: What the United States Can Learn from Other Countries. Annals of Internal Medicine. 2008 January 1;148(1):55–75. - PubMed
-
- Anderson Gerard F, Reinhardt Uwe E, Hussey Peter S, Varduhi Petrosyan. It’s the Prices, Stupid: Why the U.S. Is So Different from Other Countries. Health Affairs. 2003;22(3):89–105. - PubMed
-
- Angrisano Carlos, Farrell Diana, Kocher Bob, Laboissiere Martha, Parker Sara. MGI Report. San Francisco, CA: McKinsey Global Institute; 2007. Accounting for the Cost of Health Care in the U.S. http://www.mckinsey.com/mgi/rp/healthcare/accounting_cost_healthcare.asp.
-
- Baicker Katherine, Chandra Amitabh. Medicare Spending, the Physician Work-force, and the Quality of Health Care Received by Medicare Beneficiaries. Health Affairs. 2004 Web Exclusive, April 7. - PubMed
Publication types
MeSH terms
Grants and funding
LinkOut - more resources
Full Text Sources
Medical