. 2009 Apr;30(8):1388-98.
doi: 10.1002/elps.200800373.

Isolation of rare cells from cell mixtures by dielectrophoresis

Affiliations

Isolation of rare cells from cell mixtures by dielectrophoresis

Peter R C Gascoyne et al. Electrophoresis. 2009 Apr.

Abstract

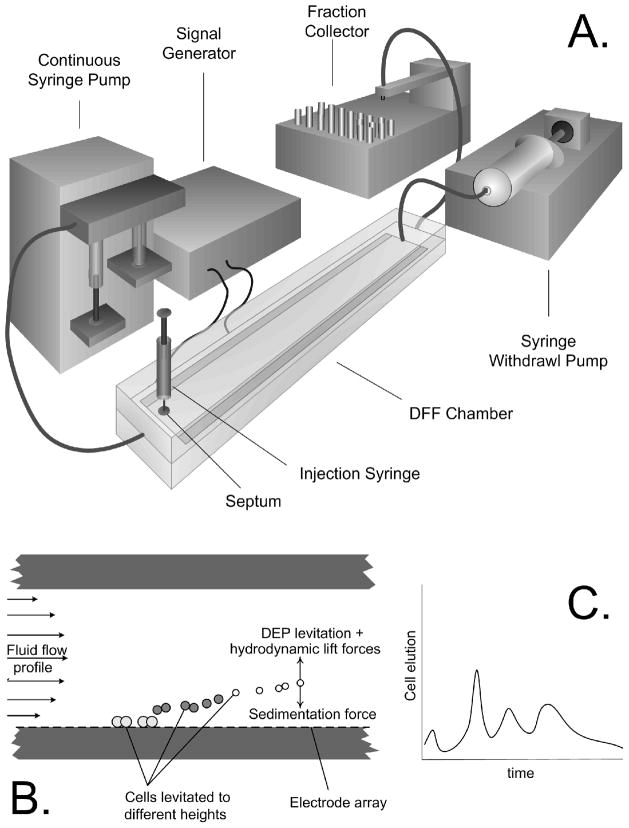
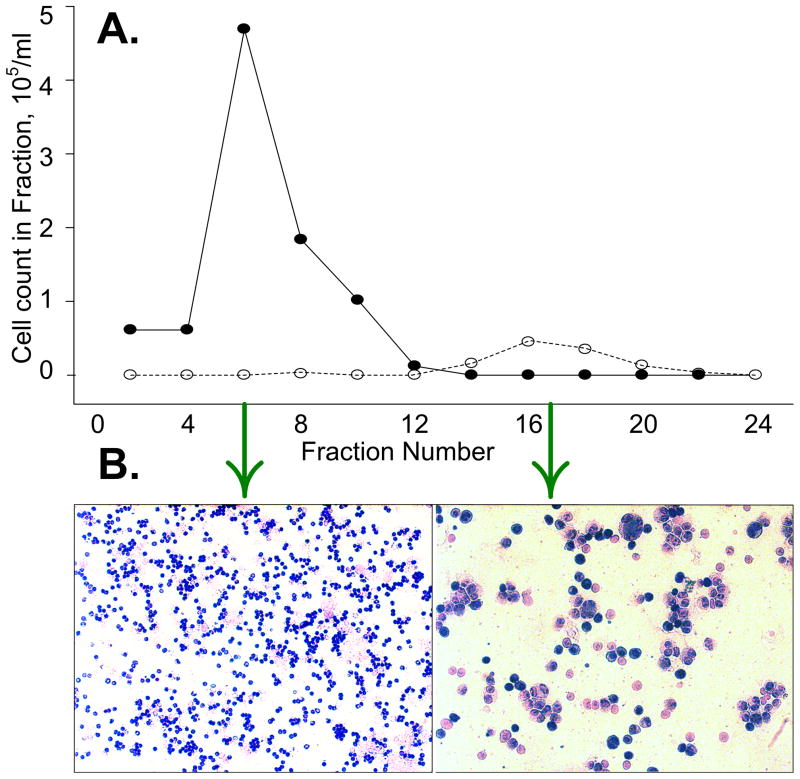
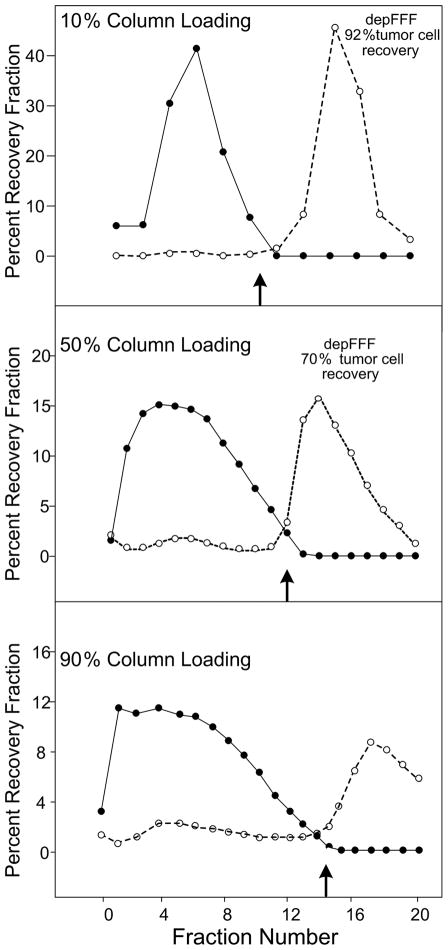
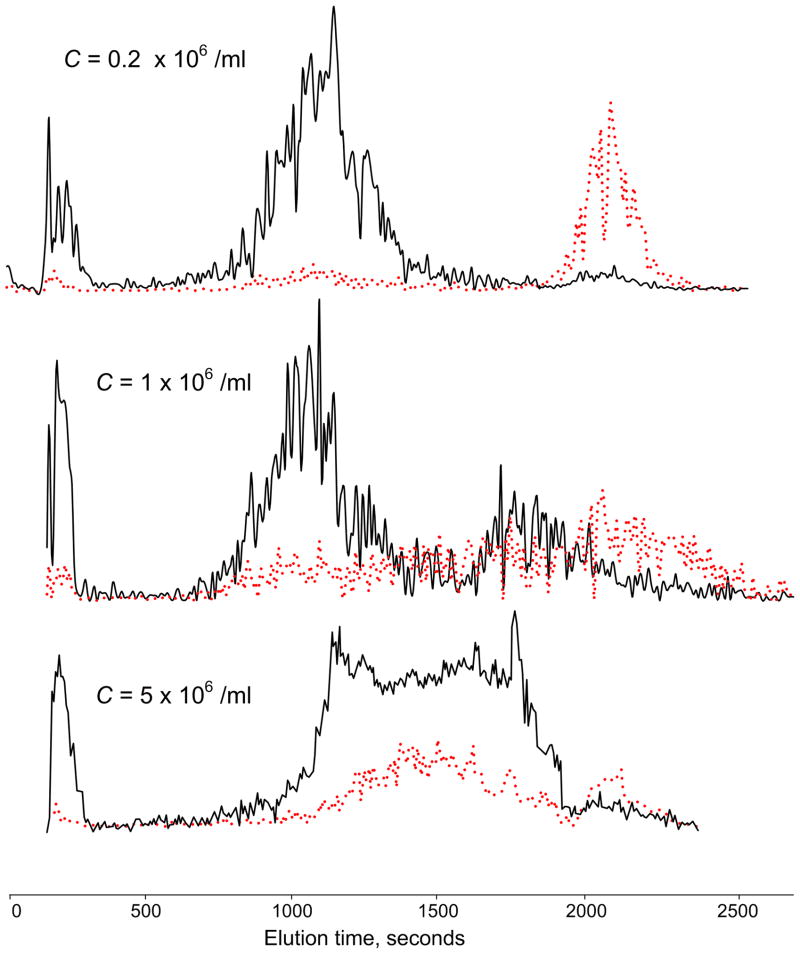
The application of dielectrophoretic field-flow fractionation (depFFF) to the isolation of circulating tumor cells (CTCs) from clinical blood specimens was studied using simulated cell mixtures of three different cultured tumor cell types with peripheral blood. The depFFF method can not only exploit intrinsic tumor cell properties so that labeling is unnecessary but can also deliver unmodified, viable tumor cells for culture and/or all types of molecular analysis. We investigated tumor cell recovery efficiency as a function of cell loading for a 25 mm wide x 300 mm long depFFF chamber. More than 90% of tumor cells were recovered for small samples but a larger chamber will be required if similarly high recovery efficiencies are to be realized for 10 mL blood specimens used CTC analysis in clinics. We show that the factor limiting isolation efficiency is cell-cell dielectric interactions and that isolation protocols should be completed within approximately 15 min in order to avoid changes in cell dielectric properties associated with ion leakage.


Figures

Figure 1
Figure 1
A. The DEP flow fractionation (depFFF) configuration used in this study. Cells were injected into the chamber by syringe and allowed to settle before flow was initiated from the gear pump and an ac electrical signal was applied to the electrode to influence the cell elution characteristics. B. Dielectrophoretic, sedimentation and hydrodynamic forces combined to influence the cell position in the hydrodynamic flow profile. C. As a result, cells having different properties eluted at different times from the chamber.
Figure 2
Figure 2
A. The relative proportion of peripheral blood (●) and cancer cells (❍) varied in the different fractions. The applied DEP frequency was 60 kHz for fractions 1 to 12, then it was switched to 15 kHz for fractions 13 to 24. B. Wright staining reveals the high ratio of tumor cells collected in fraction 17 relative to fraction 6.
Figure 3
Figure 3
Elution profiles of PBMN (●) and cancer cells (❍) as a function of the percentage of the depFFF volume that was loaded with sample prior to cell settling. The DEP frequency was switched from 60 kHz to 15 kHz at the fractions shown by the small arrows. Better recovery of tumor cells occurred if the cells remaining in the depFFF were flushed rapidly from the chamber after the DEP frequency was changed to 15 kHz (Flush recovery).
Figure 4
Figure 4
Elution profiles measured by the laser counter as a function of cell concentration loaded onto the depFFF chamber. PBMN cells (black) and tumor cells (red) were cleanly separated at a loading concentration C = 0.2 × 10⁶ cells.ml−1, but elution peak broadening and co-elution of the PBMN and tumor cells occurred as the loading was increased.
Figure 5
Figure 5
The real part of the Clausius-Mossotti factor fcm for the cancer cell lines studied and PBMN cells shown as a function of the frequency of the DEP voltage applied to the chamber electrodes. At 60 kHz, all breast tumor cell lines were attracted towards the electrodes by positive DEP forces and slowed by steric effects during separation while the PBMN cell types were levitated into the eluate flow stream by negative DEP forces and expelled quickly from the depFFF chamber. At 15 kHz, all cell types experienced repulsive DEP forces that promoted elution from the chamber.
Figure 6
Figure 6
A and B. Simulations based on the single shell dielectric model of the frequency spectrum of the real part of the Claussius-Mossotti factor (fcm) that scales the DEP force for cells having a crossover frequency of 20 kHz. A. Effect on the fcm spectrum of decreasing the cytoplasmic conductivity to the values shown. B. Effect on the fcm spectrum of increasing cell membrane conductivity to the values shown. C. Simulations of the cytoplasmic and membrane conductivities versus time when the cytoplasmic ion concentration decays exponentially with a rate constant of 400 seconds and the membrane conductivity varies inversely with the cytoplasmic conductivity. D. Effect of the changing cytoplasmic and membrane conductivities shown in C on the fcm values for two cell types that initially exhibit positive and negative DEP responses. In this simulation, the two cell types are indistinguishable by DEP after about 2000 seconds because of the ion leakage and membrane conductivity increase.

References

    1. Cristofanilli M. Cancer. 2005;103:877–880. - PubMed
    1. Riethdorf S, Fritsche H, Muller V, Rau T, Schindlbeck C, Rack B, Janni W, Coith C, Beck K, Janicke F, Jackson S, Gornet T, Christofanilli M, Pantel K. Clin Cancer Res. 2007;13:920–8. - PubMed
    1. Hayes DF, Cristofanilli M, Budd GT, Ellis MJ, Stopeck A, Miller MC, Matera J, Allard WJ, Doyle GV, Terstappen LWWM. Clin Cancer Res. 2006;12:4218–4224. - PubMed
    1. Fizazi K, Morat L, Chauveinc L, Prapotnich D, De Crevoisier R, Escudier B, Cathelineau X, Rozet F, Vallancien, Sabatier, Soria GLJ. Ann Oncol. 2007;18:518–21. - PubMed
    1. Naoe M, Ogawa Y, Morita Omori J, Takeshita K, Shichiiyo T, Okumura T, Igarashi A, Yanaihara A, Iwamoto S, Fukagai T, Miyazaki, Yoshida AH. Cancer. 2007;109:1439–1445. - PubMed

Publication types

LinkOut - more resources