. 2009 Apr 17;583(8):1337-43.
doi: 10.1016/j.febslet.2009.03.037. Epub 2009 Mar 22.

Focal adhesion disassembly requires clathrin-dependent endocytosis of integrins

Affiliations

Focal adhesion disassembly requires clathrin-dependent endocytosis of integrins

Wei-Ting Chao et al. FEBS Lett. .

Abstract

Cell migration requires the controlled disassembly of focal adhesions, but the underlying mechanisms remain poorly understood. Here, we show that adhesion turnover is mediated through dynamin- and clathrin-dependent endocytosis of activated beta1 integrins. Consistent with this, clathrin and the clathrin adaptors AP-2 and disabled-2 (DAB2) distribute along with dynamin 2 to adhesion sites prior to adhesion disassembly. Moreover, knockdown of either dynamin 2 or both clathrin adaptors blocks beta1 integrin internalization, leading to impaired focal adhesion disassembly and cell migration. Together, these results provide important insight into the mechanisms underlying adhesion disassembly and identify novel components of the disassembly pathway.


Figures
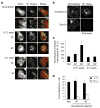
Fig. 1
Fig. 1
β1 integrin internalization is necessary for focal adhesion disassembly. (a) Nocodazole-treated HT1080 cells were incubated with 12G10 antibody at 4 °C to label ligand-bound cell surface β1 integrin. After removal of unbound antibodies and nocodazole, cells were either immediately fixed and immunostained to visualize zyxin (red in merge) and antibody–β1 integrin complexes (green in merge) or were continued to incubate at 37 °C (middle panels) or 4 °C (bottom panels) for the indicated times before immunostaining. Shown are single confocal z-sections at the substratum-facing surface. Enlarged images of the boxed area are shown below the top panels. Scale bar, 10 μm. (b) Nocodazole-treated HT1080 cells were incubated at 37 °C for 20 min with antibodies that label either activated (12G10; activated) or total (MAB1298; total) β1 integrins on the cell surface. After nocodazole washout, cells were acid-stripped, fixed and immunostained to visualize integrin–antibody complexes. Shown are representative confocal z-sections at the substratum-facing surface. (c) Quantitative analysis of β1 integrin internalization from (a). Total immunofluorescence intensity of internalized antibody–integrin complexes was analyzed from z-sections to obtain a mean pixel intensity value (expressed in arbitrary units, A.U.). (d) Quantification of zyxin-positive focal adhesion numbers from (a). Values in (c) and (d) are means ± S.E.M. (n = 3).
Fig. 2
Fig. 2
Knockdown of dynamin 2 prevents the endocytosis of activated β1 integrins. (a) HT1080 cells, pretreated with control siRNA or siRNA targeting dynamin 2, were incubated with 12G10 integrin β1 antibody for 2 h at 37 °C to allow for internalization of β1 integrin–ligand complexes. Cells were then either directly fixed or acid-stripped prior to fixation to remove non-internalized surface antibody and cells were immunostained to visualize zyxin (red in merge) and activated β1 integrin–ligand complexes (green in merge). Shown are representative confocal z-sections at the substratum-facing surface. Lower panels show regions outlined by a box at higher magnification. Scale bar, 10 μm. (b) Quantitative analysis of internalized β1 integrin from (a). Total immunofluorescence intensity of internalized antibody–integrin complexes was measured as described in Fig. 1c. (c) Quantification of focal adhesion number from (a). Values shown in (b) and (c) are means ± S.E.M. (n = 3).
Fig. 3
Fig. 3
Overexpression of dynamin 2, but not the Dyn2PRD mutant in dynamin 2-depleted cells restores β1 integrin internalization and focal adhesion disassembly. (a) Dynamin 2 siRNA-treated cells were transfected with plasmids encoding GFP (Vector), GFP-tagged wild-type dynamin 2 (Dyn2), or the Dyn2PRD mutant and were then incubated with 12G10 integrin β1 antibody for 2 h at 37 °C to allow for internalization of β1 integrin–ligand complexes. Cells were fixed, permeabilized and immunostained to visualize zyxin (blue in merge) and β1 integrin–antibody complexes (red in merge). GFP fluorescence was recorded directly (green in merge). Representative confocal z-sections at the substratum-facing surface are shown. Scale bar, 10 μm. (b) Regions outlined by boxes in (a) are shown at higher magnification. (c) Quantitative analysis of internalized β1 integrins. Immunofluorescence intensity of internalized β1 integrins was measured in the cell interior as described in Fig. 1c. (d) Quantification of focal adhesion number from (a). Values in (c) and (d) are means ± S.E.M. (n = 3).
Fig. 4
Fig. 4
Localization of dynamin 2 to focal adhesions requires its C-terminal PRD domain. HT1080 cells were transfected with Flag-tagged wild type dynamin 2 or the indicated Dyn2 mutant variants and were then treated with nocodazole, fixed and stained with anti-zyxin and anti-Flag antibodies. Only the Dyn2PRD mutant fails to accumulate within zyxin-positive adhesions (indicated by arrows). Scale bar, 10 μm.
Fig. 5
Fig. 5
Clathrin components distribute to focal adhesions before adhesion disassembly. (a) HT1080 cells were treated with vehicle (DMSO), filipin (10 μM) or MDC (60 μM) before fixation and staining for zyxin. (b) Quantification of zyxin-positive focal adhesion numbers from (a). Values are means ± S.E.M. from two independent experiments. (c) The localization of mRFP-tagged caveolin 1 (Cav1) was directly visualized in transfected nocodazole-treated HT1080 cells, whereas the localization of endogenous clathrin heavy chain (CHC), the AP-2 subunit α-adaptin, DAB2, and zyxin was analyzed by indirect immunofluorescence staining using specific antibodies. Representative examples of cells are shown. (d) A magnification of the indicated cell areas (arrows) in (c) is shown to highlight the localization of clathrin components (red in merge) within zyxin-containing (green in merge) adhesions.
Fig. 6
Fig. 6
Combined knockdown of AP-2 and DAB2 inhibits the endocytosis of activated β1 integrins and focal adhesion disassembly. (a) HT1080 cells, pretreated with control siRNA or combined siRNA targeting AP-2 and DAB2, were incubated with 12G10 integrin β1 antibody for 2 h at 37 °C to allow for internalization of β1 integrin–ligand complexes. Cells were then either directly fixed or acid-stripped prior to fixation to remove non-internalized surface antibody from cells and were then immunostained for zyxin (red in merge) and β1 integrin–ligand complexes (green in merge). Shown are representative confocal z-sections at the substratum-facing surface. Lower panels show enlarged images of the boxed area. Scale bar, 10 μm. (b) Quantitative analysis of internalized β1 integrins. Total immunofluorescence intensity of internalized antibody–integrin complexes was measured as described in Fig. 1c. (c) Quantification of focal adhesion number from (a). Values in (a–c) are means ± S.E.M. (n = 3). (d) Cells treated with the indicated siRNAs were serum-starved and cell migration across Transwell membranes was assayed in response to serum (10% FBS) present in the bottom chamber. The total number of cells passing through the membrane was determined. Results shown are expressed as the percentage of migrated cells relative to control cells, which was arbitrarily set to 100%.
Fig. 7
Fig. 7
Overexpression of dynamin 2, but not the Dyn2PRD mutant in AP-2/DAB2-depleted cells restores β1 integrin internalization and focal adhesion disassembly. (a) HT1080 cells treated with AP-2 and DAB2 siRNAs were transfected with plasmids encoding GFP (Vector), GFP-tagged wild-type dynamin 2 (Dyn2), or the Dyn2PRD mutant and were then incubated with 12G10 integrin β1 antibody for 2 h at 37 °C to allow for internalization of integrin–antibody complexes. Cells were washed, fixed, and immunostained to visualize zyxin (blue in merge) and β1 integrin–antibody complexes (red in merge). GFP fluorescence was recorded directly (green in merge). Representative confocal z-sections at the substratum-facing surface are shown. (b) Regions outlined by boxes in (a) are shown at higher magnification. (c) Quantitative analysis of internalized β1 integrins. Total immunofluorescence intensity of internalized antibody–integrin complexes was measured as described in Fig. 1c. (d) Quantification of focal adhesion number from (a). Values in (c) and (d) are means ± S.E.M. (n = 3).

References

    1. Webb DJ, Parsons JT, Horwitz AF. Adhesion assembly, disassembly and turnover in migrating cells—over and over and over again. Nat Cell Biol. 2002;4:E97–E100. - PubMed
    1. Broussard JA, Webb DJ, Kaverina I. Asymmetric focal adhesion disassembly in motile cells. Curr Opin Cell Biol. 2008;20:85–90. - PubMed
    1. Webb DJ, Donais K, Whitmore LA, Thomas SM, Turner CE, Parsons JT, Horwitz AF. FAK-Src signalling through paxillin, ERK and MLCK regulates adhesion disassembly. Nat Cell Biol. 2004;6:154–161. - PubMed
    1. Franco SJ, Rodgers MA, Perrin BJ, Han J, Bennin DA, Critchley DR, Huttenlocher A. Calpain-mediated proteolysis of talin regulates adhesion dynamics. Nat Cell Biol. 2004;6:977–983. - PubMed
    1. Ezratty EJ, Partridge MA, Gundersen GG. Microtubule-induced focal adhesion disassembly is mediated by dynamin and focal adhesion kinase. Nat Cell Biol. 2005;7:581–590. - PubMed

Publication types