. 2009 Jun;103(8):1207-17.
doi: 10.1093/aob/mcp058. Epub 2009 Mar 22.

Phenotypic, genetic and genomic consequences of natural and synthetic polyploidization of Nicotiana attenuata and Nicotiana obtusifolia

Affiliations

Phenotypic, genetic and genomic consequences of natural and synthetic polyploidization of Nicotiana attenuata and Nicotiana obtusifolia

S Anssour et al. Ann Bot. 2009 Jun.

Abstract

Background and methods: Polyploidy results in genetic turmoil, much of which is associated with new phenotypes that result in speciation. Five independent lines of synthetic allotetraploid N. x obtusiata (N x o) were created from crosses between the diploid N. attenuata (Na) (male) and N. obtusifolia (No) (female) and the autotetraploids of Na (NaT) and No (NoT) were synthesized. Their genetic, genomic and phenotypic changes were then compared with those of the parental diploid species (Na and No) as well as to the natural allotetraploids, N. quadrivalvis (Nq) and N. clevelandii (Nc), which formed 1 million years ago from crosses between ancient Na and No.

Key results: DNA fingerprinting profiles (by UP-PCR) revealed that the five N x o lines shared similar but not identical profiles. Both synthetic and natural polyploidy showed a dosage effect on genome size (as measured in seeds); however, only Nq was associated with a genome upsizing. Phenotypic analysis revealed that at the cellular level, N x o lines had phenotypes intermediate of the parental phenotypes. Both allo- and autotetraploidization had a dosage effect on seed and dry biomass (except for NaT), but not on stalk height at first flower. Nc showed paternal (Na) cellular phenotypes but inherited maternal (No) biomass and seed mass, whereas Nq showed maternal (No) cellular phenotypes but inherited paternal (Na) biomass and seed mass patterns. Principal component analysis grouped Nq with N x o lines, due to similar seed mass, stalk height and genome size. These traits separated Nc, No and Na from Nq and N x o lines, whereas biomass distinguished Na from N x o and Nq lines, and NaT clustered closer to Nq and N x o lines than to Na.

Conclusions: Both allo- and autotetraploidy induce considerable morphological, genetic and genomic changes, many of which are retained by at least one of the natural polyploids. It is proposed that both natural and synthetic polyploids are well suited for studying the evolution of adaptive responses.


Figures

Fig. 1.
Fig. 1.
Breeding scheme of N. × obtusiata lines 1–5 and autotetraploids of N. attenuata and N. obtusifolia. Allotetraploids: five emasculated N. obtusifolia (No) flowers were pollinated with excised N. attenuata (Na) anthers. Seedlings were then produced using the ovule culture method as described by Chung et al. (1988). Seedlings of the F1 hybrid were treated with 0·6 % colchicine to produce fertile plants. All the lineages were inbred for five generations. Autotetraploids: NaT and NoT were generated by treating their diploids with 0·3 % and 0·6 % colchicine, respectively. Na and No tetraploids were inbred for four and five generations, respectively.
Fig. 2.
Fig. 2.
Corolla limbs, flowers and seed morphologies of N. attenuata (Na), N. attenuata autotetraploid (NaT) (F5), N. obtusifolia (No), N. obtusifolia autotetraploid (NoT) (F4), N. × obtusiata (N × o) (lines 1–5, F5), N. clevelandii (Nc) and N. quadrivalvis (Nq). (A) Corolla limbs: NaT and NoT corolla limbs are about 1·5 times larger than those of Na and No. N × o corolla limbs are on average 1·7 times larger than those of Na. Nq corolla limbs are 3 times larger than those of Na, whereas Nc corolla limbs are 1·1 times larger than those of No. (B) Flower tubes: NaT and NoT flower tubes are similar to those of Na and No, respectively. N × o (lines 1–4) flower tubes are similar in length to those of Na, whereas those of N × o line 5 are similar to No's. Nq flower tubes are 1·4-fold longer than those of Na, whereas Nc flower tubes are similar in length to those of No. (C) Seeds: NaT and NoT seeds have the colour, shape and surface appearance of Na and No seeds, respectively. N × o (lines 1–5) seeds have intermediate parental colour and Na's seed shape. N × o (lines 1–4) seeds have the surface appearance of Na, whereas seeds from N × o line 5 have that of No. Nc and Nq seeds have the brownish pigmentation typical of No seeds.
Fig. 3.
Fig. 3.
(A) leaves and (B) rosette-stage plants of N. attenuata (Na), N. attenuata autotetraploid (NaT) (F5), N. obtusifolia (No), N. obtusifolia autotetraploid (NoT) (F4), N. × obtusiata (N × o) (lines 1–5, F5), N. clevelandii (Nc) and N. quadrivalvis (Nq). N × o (lines 1–5) leaves have long petioles and an intermediate parental shape. Nq and Nc produce ovate-elliptical leaves with long and short petioles, respectively. Synthetic polyploids rosette-stage plants develop approx. 3 d before either parent (photographs were taken at the same stage).
Fig. 4.
Fig. 4.
Genome sizes (mean C value in pg DNA ± s.e.) of N. attenuata (Na), N. attenuata autotetraploid (NaT) (F5), N. obtusifolia (No) (F5), N. obtusifolia autotetraploid (NoT) (F4), N. × obtusiata (N × o) (lines 1–5, F5), N. clevelandii (Nc) and N. quadrivalvis (Nq). Genome size was determined in ten seeds of each species using flow cytometric analysis of a single seeds. Significant differences were calculated using unpaired t-test: *, significantly different from Na (P < 0·05); +, significantly different from No (P < 0·05).
Fig. 5.
Fig. 5.
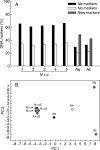
Analysis of UP-PCR DNA fingerprinting profiles of N. attenuata, N. obtusifolia, N. × obtusiata (lines 1–5), N. clevelandii (Nc) and N. quadrivalvis (Nq). (A) Percentages of Na- and No-specific DNA markers and new markers present in each species. DNA markers unique to Na or No were first identified and then recorded in the allotetraploid. DNA markers present only in the allotetraploid but not in Na and No were considered new. (B) Principal component analysis (PCA) based on DNA markers present in each species. A numerical matrix for PCA was generated by recording all DNA markers. A binary code was used to express the presence (1) or absence (0) of these markers. UP-PCR DNA fingerprinting profiles were generated for each species using two biological replicates and seven universal primers. For analysis, only the DNA markers present in both biological replicates were considered. Percentages of total variance explained by PC 1 and 2 are 55 % and 40·5%, respectively.
Fig. 6.
Fig. 6.
Quantitative phenotypical traits (mean ± s.e.) were measured in N. attenuata (Na), N. attenuata autotetraploid (NaT) (F5), N. obtusifolia (No), N. obtusifolia autotetraploid (NoT) (F4), N × obtusiata (N × o) (lines 1–5, F5), N. clevelandii (Nc) and N. quadrivalvis (Nq). For each line, guard cell length (n = 30), stomata density (n = 10) and epidermal cell area (n = 20) were measured on leaf epidermis of each species using the Axio Vision LE software. Dry biomass measurements (n = 25–30) were made at the bolting stage. Seed mass (n = 300) and stalk height at first flower (n = 25–30) were also measured for each line. Significant differences were calculated using unpaired t-test: *, significantly different from Na (P < 0·05); +, significantly different from No (P < 0·05).
Fig. 7.
Fig. 7.
Principal component analysis (PCA) of quantitative phenotypic traits measured in N. attenuata (Na), N. attenuata autotetraploid (NaT) (F5), N. obtusifolia (No), N. obtusifolia autotetraploid (NoT) (F4), N. × obtusiata (N × o) (lines 1–5, F5), N. clevelandii (Nc) and N. quadrivalvis (Nq). The quantitative phenotypic values used in this analysis are those shown in Fig. 5. Percentages of total variance explained by PC 1 and 2 are 45·5 % and 36·2%, respectively.

References

    1. The Arabidopsis Genome Initiative. Analysis of the genome sequence of the flowering plant Arabidopsis thaliana. Nature. 2000;408:796–815. - PubMed
    1. Baldwin IT, Staszakkozinski L, Davidson R. Up in smoke. I. Smoke-derived germination cues for post-fire annual, Nicotiana attenuata torr. ex. Watson. Journal of Chemical Ecology. 1994;20:2345–2371. - PubMed
    1. Beck SL, Dunlop RW, Fossey A. Stomatal length and frequency as a measure of ploidy level in black wattle, Acacia mearnsii (de Wild) Botanical Journal of the Linnean Society. 2003;141:177–181.
    1. Bennett MD, Leitch IJ. Nuclear DNA amounts in angiosperms: 583 new estimates. Annals of Botany. 1997;80:169–196.
    1. Bulat SA, Lubeck M, Alekhina IA, Jensen DF, Knudsen IMB, Lubeck PS. Identification of a universally primed-PCR-derived sequence-characterized amplified region marker for an antagonistic strain of Clonostachys rosea and development of a strain-specific PCR detection assay. Applied and Environmental Microbiology. 2000;66:4758–4763. - PMC - PubMed

Publication types