. 2009 Jun;77(6):2367-75.
doi: 10.1128/IAI.01520-08. Epub 2009 Mar 23.

Reproducible community dynamics of the gastrointestinal microbiota following antibiotic perturbation

Affiliations

Reproducible community dynamics of the gastrointestinal microbiota following antibiotic perturbation

Dionysios A Antonopoulos et al. Infect Immun. 2009 Jun.

Abstract

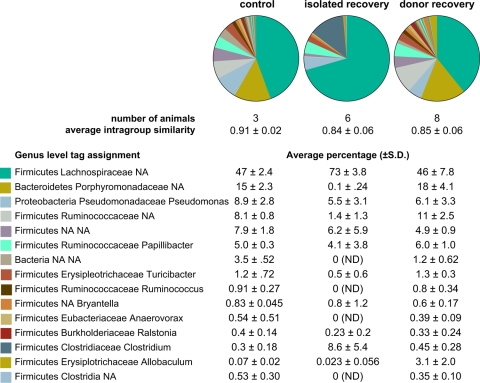
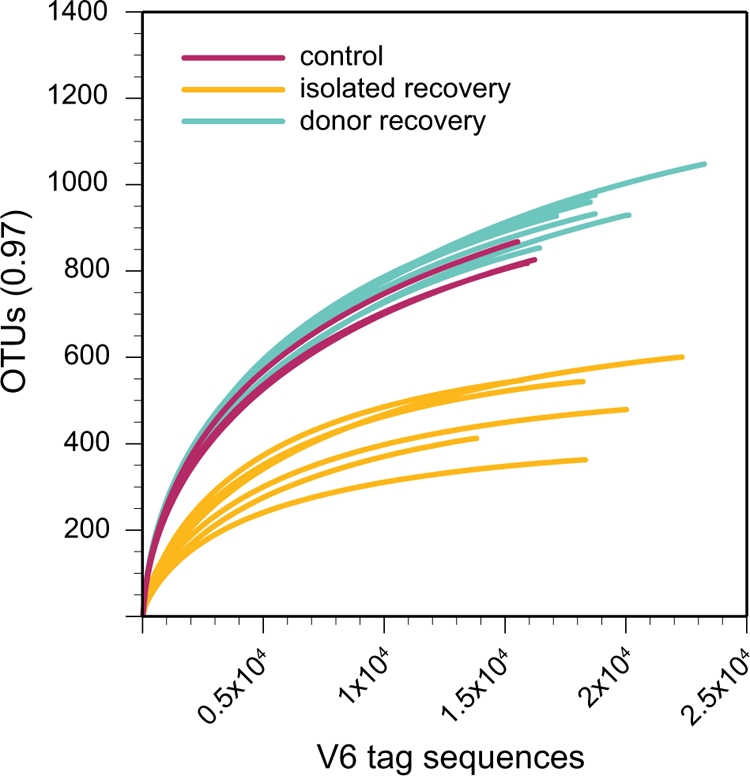
Shifts in microbial communities are implicated in the pathogenesis of a number of gastrointestinal diseases, but we have limited understanding of the mechanisms that lead to altered community structures. One difficulty with studying these mechanisms in human subjects is the inherent baseline variability of the microbiota in different individuals. In an effort to overcome this baseline variability, we employed a mouse model to control the host genotype, diet, and other possible influences on the microbiota. This allowed us to determine whether the indigenous microbiota in such mice had a stable baseline community structure and whether this community exhibited a consistent response following antibiotic administration. We employed a tag-sequencing strategy targeting the V6 hypervariable region of the bacterial small-subunit (16S) rRNA combined with massively parallel sequencing to determine the community structure of the gut microbiota. Inbred mice in a controlled environment harbored a reproducible baseline community that was significantly impacted by antibiotic administration. The ability of the gut microbial community to recover to baseline following the cessation of antibiotic administration differed according to the antibiotic regimen administered. Severe antibiotic pressure resulted in reproducible, long-lasting alterations in the gut microbial community, including a decrease in overall diversity. The finding of stereotypic responses of the indigenous microbiota to ecologic stress suggests that a better understanding of the factors that govern community structure could lead to strategies for the intentional manipulation of this ecosystem so as to preserve or restore a healthy microbiota.


Figures

FIG. 1.
FIG. 1.
Schemata for antibiotic administration. (A) Fifteen C57BL/6 IL-10−/− mice received AMB in their chow for 10 days, while 10 animals remained on control chow. Mice were euthanized either immediately after antibiotic administration or after a 2-week period of recovery on nonmedicated chow. Control animals remained on nonmedicated chow for the entire experiment. (B) Five animals remained on sterile water, while 15 mice were treated with 0.5 mg/ml of cefoperazone in sterile drinking water for 10 days. The antibiotic-treated animals were subsequently divided into three groups. One group of three animals was immediately sacrificed. One group of six animals (divided into two cages) was returned to sterile water without antibiotics for a 6-week recovery period. A final group of six animals (also divided into two cages) was returned to water without antibiotics, and a nontreated control mouse was added to each cage for the 6-week recovery period. The ceca of all animals were harvested for microbial community analysis.
FIG. 2.
FIG. 2.
Comparison of microbial community composition in the ceca of antibiotic-treated mice. More than 1 million V6 sequence tags were retrieved from cecal DNA purified from untreated mice (control), animals that received AMB in chow for 10 days (antibiotic treated), and AMB-treated mice that were allowed to recover on plain chow for 2 weeks (recovery). The sequence tags were classified to the level of bacterial division (phylum). The pie charts show the distribution of the pooled tags recovered from each experimental group. Numbers are mean percentages of pooled tags in each experimental group assigned to particular phyla (± standard deviations).
FIG. 3.
FIG. 3.
Genus level diversity of the gut communities in the ceca of control animals. Approximately 16,000 V6 SSU hypervariable region tags were retrieved from the cecal mucosa-associated microbiota from each of three wild-type C57BL/6 mice. Pie charts show the distribution of the most prevalent taxonomically assigned tags, while the percentages for the 12 most common assignments are given below. Bray-Curtis similarities were calculated for each pairwise comparison. The nonparametric Chao1 diversity estimator was calculated for each community based on 97% sequence similarity. c.i., confidence interval.
FIG. 4.
FIG. 4.
Comparison of microbial communities in cefoperazone-treated animals. More than 300,000 V6 sequence tags were retrieved from the ceca of cefoperazone-treated mice that recovered from drug treatment in the presence or absence of an untreated “donor” animal. Taxonomic assignments at the genus level were provided for the tags, and the pairwise Bray-Curtis distance was calculated for all possible comparisons. The Bray-Curtis values are presented in a heat map fashion as a color-coded distance matrix, with the most similar communities (Bray-Curtis similarity, 1.0) represented by blue and the most dissimilar communities (Bray-Curtis similarity, 0.0) represented by red. The housing of the animals is indicated, and each animal that served as a “donor” is marked with a star.
FIG. 5.
FIG. 5.
Genus-level diversity of the gut communities from cefoperazone-treated animals. The taxonomic assignments of V6 tags from untreated animals (control), animals that recovered without an untreated animal (isolated recovery), and animals that recovered in the presence of an untreated animal (donor recovery) are shown. The pie charts show the most abundant genus level assigned tags for the pooled animals in each experimental group. The average (± standard deviation) percentage of tags belonging to each genus is given below the pie charts. ND, not detected; NA, not assignable with ≥67% confidence via GAST (22).
FIG. 6.
FIG. 6.
Rarefaction analysis of microbial communities from cefoperazone-treated animals. The number of assigned phylotypes is plotted as a function of the number of tags retrieved. The V6 tags from untreated animals (control), animals that recovered without an untreated animal (isolated recovery), and animals that recovered in the presence of an untreated animal (donor recovery) were used to construct rarefaction curves with an OTU definition of >97% sequence similarity.

References

    1. Aas, J., C. E. Gessert, and J. S. Bakken. 2003. Recurrent Clostridium difficile colitis: case series involving 18 patients treated with donor stool administered via a nasogastric tube. Clin. Infect. Dis. 36580-585. - PubMed
    1. Allison, S. D., and J. B. Martiny. 2008. Resistance, resilience, and redundancy in microbial communities. Proc. Natl. Acad. Sci. USA 105(Suppl. 1)11512-11519. - PMC - PubMed
    1. Bäckhed, F., R. E. Ley, J. L. Sonnenburg, D. A. Peterson, and J. I. Gordon. 2005. Host-bacterial mutualism in the human intestine. Science 3071915-1920. - PubMed
    1. Bartlett, J. G. 2008. Historical perspectives on studies of Clostridium difficile and C. difficile infection. Clin. Infect. Dis. 46(Suppl. 1)S4-S11. - PubMed
    1. Brandl, K., G. Plitas, C. N. Mihu, C. Ubeda, T. Jia, M. Fleisher, B. Schnabl, R. P. DeMatteo, and E. G. Pamer. 2008. Vancomycin-resistant enterococci exploit antibiotic-induced innate immune deficits. Nature 455804-807. - PMC - PubMed

Publication types