. 2009 Jun;29(11):3124-33.
doi: 10.1128/MCB.00139-09. Epub 2009 Mar 23.

G clustering is important for the initiation of transcription-induced R-loops in vitro, whereas high G density without clustering is sufficient thereafter

Affiliations

G clustering is important for the initiation of transcription-induced R-loops in vitro, whereas high G density without clustering is sufficient thereafter

Deepankar Roy et al. Mol Cell Biol. 2009 Jun.

Abstract

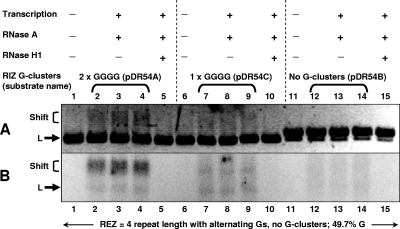
R-loops form cotranscriptionally in vitro and in vivo at transcribed duplex DNA regions when the nascent RNA is G-rich, particularly with G clusters. This is the case for phage polymerases, as used here (T7 RNA polymerase), as well as RNA polymerases in bacteria, Saccharomyces cerevisiae, avians, mice, and humans. The nontemplate strand is left in a single-stranded configuration within the R-loop region. These structures are known to form at mammalian immunoglobulin class switch regions, thus exposing regions of single-stranded DNA for the action of AID, a single-strand-specific cytidine deaminase. R-loops form by thread-back of the RNA onto the template DNA strand, and here we report that G clusters are extremely important for the initiation phase of R-loop formation. Even very short regions with one GGGG sequence can initiate R-loops much more efficiently than random sequences. The high efficiencies observed with G clusters cannot be achieved by having a very high G density alone. Annealing of the transcript, which is otherwise disadvantaged relative to the nontemplate DNA strand because of unfavorable proximity while exiting the RNA polymerase, can offer greater stability if it occurs at the G clusters, thereby initiating an R-loop. R-loop elongation beyond the initiation zone occurs in a manner that is not as reliant on G clusters as it is on a high G density. These results lead to a model in which G clusters are important to nucleate the thread-back of RNA for R-loop initiation and, once initiated, the elongation of R-loops is primarily determined by the density of G on the nontemplate DNA strand. Without both a favorable R-loop initiation zone and elongation zone, R-loop formation is inefficient.


Figures

FIG. 1.
FIG. 1.
Locations of G in the substrates used for studying the effects of G clusters in the RIZ. As reflected by the substrate names on the left, the substrates are organized in groups of three (A, C, and B). The positions of G on the nontemplate strand are displayed as solid circles. The first set of three substrates (pDR18 set) has clusters of mostly GGGGs in the REZ. The top molecule (pDR18A) has two additional GGGG clusters in the RIZ, which is upstream of the REZ. The second substrate (pDR18C) has one additional GGGG-cluster motif in the RIZ, and the last molecule in the set (pDR18B) has a random sequence in the RIZ of the same length as the other substrates. The pDR22 set, the pDR26 set, and the pDR54 set are represented similarly. The REZ of the pDR22 set contains G clusters, but none with a size more than GGG. The pDR26 substrate only contains GG clusters in the REZ. In the pDR54 set, the REZ contains 49.7% Gs on the nontemplate strand (same as the G density in the REZ of the pDR18 set) but no G clusters. The Gs are distributed over the length of the REZ, with Gs alternating with A, C, or T. The RIZs are of the same length in the different sets of substrates, and the same applies to the REZs. Each G is represented as a solid circle, and other nucleotides are indicated as open circles. The nucleotide positions have been noted below the pDR54B representation.
FIG. 2.
FIG. 2.
Effect of G clusters in the RIZ on R-loop formation. Analysis and map of R-loop molecules in pDR18A, pDR18C, and pDR18B with RIZ motif A (2 × GGGG), C (1 × GGGG), or B (no G clusters) are shown. These plasmids have identical REZ regions. (A) Linearized pDR18A, pDR18C, and pDR18B substrates were either mock transcribed (lanes 1, 6, and 11 for pDR18A, pDR18C, and pDR18B, respectively) or transcribed with T7 RNA polymerase in the presence of [α-32P]UTP and treated with RNase A afterward (lanes 2 to 4, lanes 6 to 8, and lanes 12 to 14 in triplicate for pDR18A, pDR18C, and pDR18B, respectively). The fifth lane in each set is a transcribed sample treated with RNase A and RNase H1 (lanes 5, 10, and 15 for pDR18A, pDR18C, and pDR18B, respectively). The top panel is the ethidium-stained gel profile. The position of the linear fragment containing the switch region is designated “L.” R-loop molecules run slower than “L” and are seen as a shifted band designated as “Shift.” The shifted band is not present in the RNase H-treated lane, confirming the RNA-DNA hybrid nature of the shifted species. (B) [α-32P]UTP radiolabel profile of the same gel shown in panel A after phosphorimager exposure. Most of the radiolabel localizes with the “Shift” bands, but not with the “L” fragments, and is not seen in the mock-transcribed lanes or in the RNase H-treated samples at either position. (C) Representation of single-stranded regions in the DNA nontemplate strand. Transcribed substrates were treated with sodium bisulfite to convert Cs in the single-stranded regions to Us. PCR amplification, cloning, and colony lift hybridization were done to calculate R-loop frequency (also see Table 1) and detect regions of single-strandedness (read as stretches of C-to-T conversions with sequencing). The top line is a diagram of the linearized substrate, showing the T7 promoter, followed by the RIZ sequence A, C, or B upstream (shown as an inverted triangle) of the REZ switch repeats represented as thick arrows. In each set, the first line shows all Cs on the nontemplate strand as vertical lines. Each of the following lines represents an independent nontemplate strand derivative molecule, with vertical lines representing observed as C-to-T conversions. Some molecules with R-loop-induced single-stranded stretches of conversion were incomplete for the conversion information on the nontemplate strand, and only the length to which the molecule was informative for the nontemplate strand has been shown. The asterisks mark the position of the internal C in the CCmetA/TGG sequence that gets methylated by bacterial dcm (DNA cytosine methylase) enzyme and therefore remains unconverted upon sodium bisulfite treatment.
FIG. 3.
FIG. 3.
Effect of reducing the REZ G clusters from GGGG to GGG. Analysis and maps of R-loop molecules in pDR22A, pDR22C, and pDR22B with RIZ motif A (2 × GGGG), C (1 × GGGG), or B (no G clusters) and an identical REZ with maximum G-cluster size of GGG are shown. (A) Representation is similar to Fig. 2A. Linearized pDR22A, pDR22C, and pDR22B substrates were either mock transcribed (lanes 1, 6, and 11 for pDR22A, pDR22C, and pDR22B, respectively) or transcribed with T7 RNA polymerase in the presence of [α-32P]UTP and treated with RNase A afterward (lanes 2 to 4, lanes 6 to 8, and lanes 12 to 14 in triplicate for pDR22A, pDR22C, and pDR22B, respectively). The fifth lane in each set is transcribed sample treated with RNase A and RNase H1 (lanes 5, 10, and 15 for pDR22A, pDR22C, and pDR22B, respectively). The top panel is the ethidium-stained gel profile. The position of switch region containing linear fragment is designated “L.” The R-loop-induced shift is designated as “Shift.” (B) [α-32P]UTP radiolabel profile of the same gel shown in panel A after phosphorimager exposure. The positions of shifted species and the linearized restriction fragment have been marked as “Shift” and “L,” respectively. (C) Representation of single-stranded regions in the DNA nontemplate strand detected by colony lift hybridization and sequencing after sodium bisulfite treatment. Similar to the description in Fig. 2C, the top line represents the linearized substrate, showing the T7 promoter, followed by the RIZ sequence A, C, or B upstream (shown as an inverted triangle) of the REZ that contains the modified switch repeats (GGG clusters) represented as thick arrows. The first line in each set shows all Cs on the nontemplate strand. Each of the following lines is an independent nontemplate strand derivative molecule, with vertical lines representing observed C-to-T conversions. Some molecules with R-loop-induced single-stranded stretches of conversions were incomplete for the conversion information on the nontemplate strand, and only the length to which the molecule was informative for the nontemplate strand has been shown. The asterisks mark the position of the methylated C in bacterial dcm methylation sites (CCmetA/TGG) that remain unconverted.
FIG. 4.
FIG. 4.
Effect of reducing the REZ G clusters from GGGG to GG. Experiments to detect the presence of transcription-induced R-loops in pDR26A, pDR26C, and pDR26B with RIZ motif A (2 × GGGG), C (1 × GGGG), or B (no G clusters) and an identical REZ with maximum G-cluster size of GG are shown. (A) Representation is similar to Fig. 2A. Linearized pDR26A, pDR26C, and pDR26B substrates were either mock transcribed (lanes 1, 6, and 11 for pDR26A, pDR26C, and pDR26B, respectively) or transcribed with T7 RNA polymerase in the presence of [α-32P]UTP and treated with RNase A afterward (lanes 2 to 4, lanes 6 to 8, and lanes 12 to 14 in triplicate for pDR26A, pDR26C, and pDR26B, respectively). The fifth lane in each set is transcribed sample treated with RNase A and RNase H1 (lanes 5, 10, and 15 for pDR26A, pDR26C, and pDR26B, respectively). The top panel is the ethidium-stained gel profile. The position of the switch region containing linear fragment is designated “L.” No discernible R-loop-induced shifted species could be located above the linear fragment “L” for pDR26A, pDR26C, or pDR26B. (B) [α-32P]UTP radiolabel profile of the same gel shown in panel A after phosphorimager exposure. No shifted species was observed for the transcribed samples. Similar to panel A, the expected position of the linearized restriction fragment has been marked “L.” respectively. (C) Representation of a molecule with a long stretch of single-strandedness in the DNA nontemplate strand detected by colony lift hybridization and sequencing after sodium bisulfite treatment. Similar to the description in Fig. 2C, the top line represents the linearized substrate, showing the T7 promoter, followed by the RIZ sequence A (shown as an inverted triangle) and the REZ with modified switch repeats (GG clusters) represented as thick arrows. The next line in the set shows all Cs on the nontemplate strand. The following line shows the only nontemplate strand-derived molecule detected in an R-loop conformation (of 432 molecules screened; see also Table 1), with vertical lines representing observed C-to-T conversions. The asterisks mark the position of the methylated C in bacterial dcm methylation sites (CCmetA/TGG) that remain unconverted.
FIG. 5.
FIG. 5.
Effect of reducing the REZ G clusters from GGGG to G while maintaining a high overall REZ G density. Experiments are shown analyzing transcription-induced R-loops in pDR54A, pDR54C, and pDR54B with RIZ motif A (2 × GGGG), C (1 × GGGG), or B (no G clusters) and an identical REZ with a high nontemplate strand G density (49.7% Gs, organized as GNGNGN…) with no G clusters. (A) Linearized pDR54A, pDR54C, and pDR54B substrates were either mock transcribed (lanes 1, 6, and 11 for pDR54A, pDR54C, and pDR54B, respectively), transcribed with T7 RNA polymerase in the presence of [α-32P]UTP and treated with RNase A afterward (lanes 2 to 4, lanes 6 to 8, and lanes 12 to 14 in triplicates for pDR54A, pDR54C, and pDR54B, respectively). The fifth lane in each set is transcribed sample treated with RNase A and RNase H1 (lanes 5, 10, and 15 for pDR54A, pDR54C, and pDR54B, respectively). The top panel is the ethidium-stained gel profile. The position of the linear fragment containing the switch region is designated “L.” The position of the R-loop induced shift is marked with a bracket and designated as “Shift.” (B) [α-32P]UTP radiolabel profile of the same gel shown in panel A after phosphorimager exposure. The shifted position and the linearized restriction fragment have been marked as “Shift” and “L,” respectively.
FIG. 6.
FIG. 6.
Role of G clusters versus high G density in the RIZ in R-loop formation efficiency. Linearized pDR51 (three Sγ3 G-clustered repeats), pDR54 (four-repeat long and dispersed high G density region without any G clustering), pDR70 (one repeat long dispersed and high G density region followed by three Sγ3 repeats) and pDR18 (four Sγ3 G-clustered repeats) were either mock transcribed (lanes 1, 6, 11, and 16 for pDR51, pDR54, pDR70, and pDR18, respectively) or transcribed with T7 RNA polymerase in the presence of [α-32P]UTP and treated with RNase A afterward (lanes 2 to 4, lanes 7 to 9, lanes 12 to 14, and lanes 17 to 19 in triplicates for pDR51, pDR54, pDR70, and pDR18, respectively). The fifth lane in each set is transcribed sample treated with RNase A and RNase H1 (lanes 5, 10, 15, and 20 for pDR51, pDR54, pDR70, and pDR18, respectively). The first repeat of these substrates (representing the RIZ) has approximately similar G density with dispersed (50% Gs in pDR54 and pDR70) or clustered (45.8% Gs in pDR51 and pDR18) distribution on the nontemplate strand. (A) The top panel is the ethidium-stained gel profile. The switch region containing linear fragment of pDR51 contains three repeats and therefore has a faster gel mobility than the switch region/modified switch region containing fragments of pDR54, pDR70, and pDR18, which have four repeat long regions. The positions of the linearized restriction fragments are marked “L.” The positions of R-loop-induced shifts are marked as “Shift.” (B) [α-32P]UTP radiolabel profile of the same gel shown in panel A after phosphorimager exposure. The shifted positions and the linearized restriction fragments have been marked as “Shift” and “L,” respectively. A concise description of the substrate switch regions is shown below panel B.
FIG. 7.
FIG. 7.
Model of R-loop initiation by nucleation at G clusters. (A) This diagram depicts events prior to or without R-loop formation. The two DNA strands separated by the RNA polymerase are reannealing to form a duplex. The drawing is not to scale, and the reannealing of the two DNA strands may occur anywhere between (or on) the surface of the RNA polymerase and some uncertain number of base pairs upstream of the polymerase. The black downward arrow (DNA on) represents the duplex formation propensity of the two DNA strands. Thermodynamically, all RNA-DNA duplexes are more stable than the DNA-DNA duplexes, but the DNA-DNA duplex ultimately prevails because of more favorable proximity of the two DNA strands. The dashed black arrow pointing upwards (DNA off) is the propensity of the DNA duplex to separate into template and nontemplate strands (breathing). The red arrows are the propensities of the transcript to associate (RNA on; red upward arrow) or dissociate (RNA off; red downward arrow) with the template strand, and the red arrows are thinner than the black arrows because the RNA transcript exits the RNA polymerase away from the DNA and consequently is relatively disadvantaged sterically for association with the template DNA strand. (B) Model of initiation of R-loop formation when G clusters are present in the transcript. The association of the RNA with the DNA template strand is strengthened at the RNA-DNA hybrid regions containing G clusters (thereby weakening the RNA-DNA dissociation propensity; dashed red arrow). This happens because of a considerable increase in the local thermodynamic stability of the RNA-DNA hybrid (see Tables S1 to S4 and additional discussion in the supplemental material). This initial hybridization or stable nucleation event provides an increased opportunity for the rest of the transcript to hybridize with the DNA template (depending on the downstream G-density in the REZ). The presence of G clusters on the nontemplate strand also increases the breathing of the DNA duplex (now depicted as a solid upward black arrow). Therefore, the RNA-DNA nucleation event may occur after the two DNA strands anneal (on the surface of the upstream side of the RNA polymerase) but then breathe open, thereby allowing the RNA transcript to “invade” and anneal to the template DNA strand. The increased RNA-DNA hybrid length (extension of the R-loop downstream [i.e., REZ]) and the presence of G-richness or other G clusters in the transcript impart greater stability to the R-loop structure because of increased difference between the RNA-DNA thermodynamic stability over the DNA-DNA duplex stability in favor of the RNA-DNA hybrid. Once formed, the R-loop terminates downstream when the difference between the RNA-DNA and DNA-DNA stability is smaller, such that the proximity advantage of the DNA-DNA annealing prevails.

Similar articles

Cited by

References

    1. Aguilera, A., and B. Gomez-Gonzalez. 2008. Genome instability: a mechanistic view of its causes and consequences. Nat. Rev. Genet. 9204-217. - PubMed
    1. Artsimovitch, I., and R. Landick. 2002. The transcriptional regulator RfaH stimulates RNA chain synthesis after recruitment to elongation complexes by the exposed nontemplate DNA strand. Cell 109193-203. - PubMed
    1. Bandwar, R. P., N. Ma, S. A. Emanuel, M. Anikin, D. G. Vassylyev, S. S. Patel, and W. T. McAllister. 2007. The transition to an elongation complex by T7 RNA polymerase is a multistep process. J. Biol. Chem. 28222879-22886. - PMC - PubMed
    1. Barreto, V. M., Q. Pan-Hammarstrom, Y. Zhao, L. Hammarstrom, Z. Misulovin, and M. C. Nussenzweig. 2005. AID from bony fish catalyzes class switch recombination. J. Exp. Med. 202733-738. - PMC - PubMed
    1. Bottaro, A., R. Lansford, L. Xu, J. Zhang, P. Rothman, and F. W. Alt. 1994. S region transcription per se promotes basal IgE class switch recombination but additional factors regulate the efficiency of the process. EMBO J. 13665-674. - PMC - PubMed

Publication types

LinkOut - more resources