. 2009 Jun;29(11):3173-85.
doi: 10.1128/MCB.01807-08. Epub 2009 Mar 23.

PLRG1 is an essential regulator of cell proliferation and apoptosis during vertebrate development and tissue homeostasis

Affiliations

PLRG1 is an essential regulator of cell proliferation and apoptosis during vertebrate development and tissue homeostasis

André Kleinridders et al. Mol Cell Biol. 2009 Jun.

Abstract

PLRG1, an evolutionarily conserved component of the spliceosome, forms a complex with Pso4/SNEV/Prp19 and the cell division and cycle 5 homolog (CDC5L) that is involved in both pre-mRNA splicing and DNA repair. Here, we show that the inactivation of PLRG1 in mice results in embryonic lethality at 1.5 days postfertilization. Studies of heart- and neuron-specific PLRG1 knockout mice further reveal an essential role of PLRG1 in adult tissue homeostasis and the suppression of apoptosis. PLRG1-deficient mouse embryonic fibroblasts (MEFs) fail to progress through S phase upon serum stimulation and exhibit increased rates of apoptosis. PLRG1 deficiency causes enhanced p53 phosphorylation and stabilization in the presence of increased gamma-H2AX immunoreactivity as an indicator of an activated DNA damage response. p53 downregulation rescues lethality in both PLRG1-deficient MEFs and zebrafish in vivo, showing that apoptosis resulting from PLRG1 deficiency is p53 dependent. Moreover, the deletion of PLRG1 results in the relocation of its interaction partner CDC5L from the nucleus to the cytoplasm without general alterations in pre-mRNA splicing. Taken together, the results of this study identify PLRG1 as a critical nuclear regulator of p53-dependent cell cycle progression and apoptosis during both embryonic development and adult tissue homeostasis.


Figures

FIG. 1.
FIG. 1.
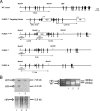
Conventional inactivation of the PLRG1 gene. (A) Northern RNA hybridization analysis of PLRG1 expression during embryogenesis. Upper panel, PLRG1 probe; lower panel, 18S and 28S RNA loading controls. Numbers indicate the days of gestation (ED). (B) Expression analysis of PLRG1 in tissues from adult mice. Upper panel, PLRG1 probe; lower panel, 18S and 28S RNA loading controls. dpc, days postcoitum. (C) Schematic representation of the PLRG1 gene replacement vector and its respective localization within the murine PLRG1 locus. WT, wild type. SA and LA, long and short arms of homology, respectively. (D) Verification of PLRG1 gene replacement. Left panel, Southern blot analysis of ES cell clones hybridized with the 5′ probe. Right panel, Southern blot of the same clones hybridized with the probe corresponding to the neomycin resistance gene for verification of single integration (RI, random integrant; HR, homologous recombinant).
FIG. 2.
FIG. 2.
Embryonic lethality in PLRG1-deficient mice. Shown is a representative morphology of wild-type (WT) and PLRG1-KO (KO) embryos at E1.5. Wild-type embryos show a normal two-cell stage, whereas KO embryos are degenerated, showing failed division and fragmented nuclei. Scale bar, 10 μm.
FIG. 3.
FIG. 3.
Conditional inactivation of the PLRG1 gene. (A) Schematic representation of the targeting strategy to introduce loxP sites (triangle) into the PLRG1 locus. (B) Southern blot analysis of ES cell clones after transfection with the targeting construct shown in panel A. Blots were hybridized with the probe depicted in panel A (WT, wild-type; HR, homologous recombinant). The upper left panel shows a homologous recombinant (1). The lower left panel shows the 5.8-kb band for single integration (1, 2, and 3, homologous recombinants). The right panel shows the PCR analysis with primers flanking the 3′ loxP site confirming the cointegration of the loxP site (1 and 3, heterozygous clone; 2, WT clone).
FIG. 4.
FIG. 4.
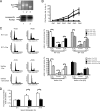
PLRG1 deficiency in MEFs causes cell cycle arrest. (A) Upper panel, genomic PCR analysis of wild-type (WT; 1 and 2) and PLRG1flox/flox MEFs (3) after treatment with cell-permeable Cre protein. Lower panel, Western blot analysis of PLRG1flox/flox MEFs before (1) and after (2) Cre treatment. (B) Growth rates of viable untreated or Cre-treated wild-type and PLRG1flox/flox (lox/lox) MEFs. Circles, wild-type MEFs; squares, PLRG1flox/flox MEFs; closed symbols, without Cre; open symbols, with Cre. Data represent means ± standard errors of the means of three independent experiments each performed in duplicate. (C) FACS analysis of serum (fetal calf serum [FCS])-stimulated cell cycle progression in untreated or Cre-treated wild-type and PLRG1flox/flox MEFs. Left panel, different cell cycle phases of untreated or Cre-treated wild-type and PLRG1flox/flox MEFs [lox/lox −Cre and lox/lox +Cre (KO)] before serum stimulation (−FCS) and 24 h after serum stimulation (+FCS) (the total number of cells counted for each condition was 25,000). Right panel, the percentage of the respective MEFs in different cell cycle phases before and after serum stimulation. Values represent means ± standard errors of the means from three independent experiments (*, P < 0.05). (D) [3H]thymidine incorporation after 0, 16, and 24 h of serum stimulation in untreated PLRG1flox/flox (open bars) and Cre-treated PLRG1flox/flox (closed bars) MEFs. Values represent means ± standard errors of the means from three independent experiments (*, P < 0.05).
FIG. 5.
FIG. 5.
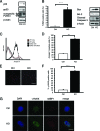
PLRG1 deficiency results in increased apoptosis. (A) Western blot analysis of untreated PLRG1flox/flox (Ctrl) and Cre-treated PLRG1flox/flox (KO) cells. MEFs were probed with the respective antibodies. β-Actin served as the loading control. (B) TUNEL analysis of control (Ctrl) and PLRG1-deficient MEFs. The percentage of apoptotic cells in control and PLRG1-deficient MEFs is shown. Values represent means ± standard errors of the means from three independent experiments (***, P < 0.001). Right panel, expression of Bax, Bcl-2, and active cleaved caspase 3 of control (Ctrl) and PLRG1-deleted (KO) MEFs. β-Actin served as the loading control. (C) Annexin V analysis of untreated (WT −Cre) or Cre-treated wild-type (WT +Cre) and PLRG1flox/flox [lox/lox −Cre and lox/lox +Cre (KO)] MEFs (the total number of cells counted for each condition was 25,000). (D) The percentage of annexin V-positive cells of untreated PLRG1flox/flox (Ctrl) and Cre-treated PLRG1flox/flox (KO) MEFs. Values represent means ± standard errors of the means from three independent experiments (***, P < 0.001). (E) Analysis of γ-H2AX phosphorylation in untreated (Ctrl) and Cre-treated PLRG1flox/flox MEFs (KO). Photomicrographs of phospho-S139-γ-H2AX-stained untreated (Ctrl) and PLRG1-deficient MEFs (KO) are shown. Scale bar, 100 μm. (F) Percentage of γ-H2AX-positive cells in untreated (Ctrl) and PLRG1-deficient MEFs (KO). Values represent means ± standard errors of the means from three independent experiments (***, P < 0.001). (G) Analysis of the colocalization of γ-H2AX and 53BP1 in control (Ctrl) and PLRG1-deficient MEFs (KO). Scale bar, 10 μm.
FIG. 6.
FIG. 6.
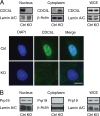
Interaction of PLRG1 and CDC5L. (A) Upper panel, Western blot analysis of immunoreactive CDC5L in nuclear, cytosolic, and whole-cell extracts (WCE) of control (Ctrl) and PLRG1-deficient (KO) MEFs. Similar results were obtained in three independent experiments. β-Actin and lamin A/C served as loading controls. Lower panel, immunofluorescent detection of CDC5L localization in control (Ctrl) and PLRG1-deficient (KO) MEFs. Bar, 10 μm. (B) Western blot analysis of immunoreactive Prp19 in nuclear, cytosolic, and whole-cell extracts (WCE) of control (Ctrl) and PLRG1-deficient (KO) MEFs. Similar results were obtained in three independent experiments. β-Actin and lamin A/C served as loading controls.
FIG. 7.
FIG. 7.
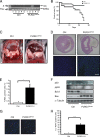
Conditional inactivation of PLRG1 in heart cells causes apoptosis. (A) Heart-restricted PLRG1 deficiency in PLRG1Δmus mice. PCR analysis on genomic DNA isolated from different organs of 5-day-old PLRG1flox/flox and PLRG1Δmus mice. The panel shows the specific deletion of PLRG1 in the heart using primers flanking exon 3. The excision of exon 3 is indicated by the PCR amplification of a 1-kb DNA fragment. PCR analysis with primers flanking the 3′ loxP site was used as a loading control (lanes: 1, brain; 2, skeletal muscle; 3, heart; 4, liver; 5, spleen). (B) Survival rates of control (open circles) (n = 40) and PLRG1Δmus (closed circles) (n = 14) mice. (C) Autopsy of postnatal day 24 wild-type (Ctrl) and PLRG1Δmus mice. Note the enlarged heart for PLRG1Δmus compared to that of the wild type. (D) Histological analysis of control (Ctrl) and PLRG1Δmus heart tissue at postnatal day 24. Upper and lower panels, H&E- and TUNEL-stained control and PLRG1Δmus heart sections, respectively. Note the clearly visible increased cardiomyocyte apoptosis in PLRG1Δmus hearts (lower). Scale bar, 100 μm. (E) Percentage of TUNEL-positive cells in hearts of PLRG1flox/flox (ctrl) and PLRG1Δmus mice. Values represent means ± standard errors of the means from three independent experiments (*, P < 0.05). (F) Western blot analysis of total cellular protein extracts from control (Ctrl) and PLRG1Δmus hearts probed with the respective antibodies. α-Tubulin served as a loading control. (G) Analysis of γ-H2AX phosphorylation in hearts of PLRG1flox/flox (Ctrl) and PLRG1Δmus mice. Scale bar, 20 μm. (H) Percentage of γ-H2AX positive cells in hearts of PLRG1flox/flox (Ctrl) and PLRG1Δmus mice. Values represent means ± standard errors of the means from three independent experiments (***, P < 0.001).
FIG. 8.
FIG. 8.
PLRG1 deficiency in the CNS reveals increased apoptosis. (A) Analysis of neuron-restricted recombination of the PLRG1flox/flox allele. The panel shows the specific deletion of PLRG1 in the brain of PLRG1ΔCNS mice. Using a primer pair flanking exon 3, the appearance of a product of 1 kb indicated the excision of exon 3. PCR analysis with primers flanking the 3′ loxP site was used as a loading control (lanes: 1, brain; 2, skeletal muscle; 3, heart; 4, liver; 5, spleen). (B) Survival rates of control (n = 25) and PLRG1ΔCNS (n = 12) mice at days 1, 3, and 9. (C) Immunohistochemical analysis of brains dissected from 3-day-old control (Ctrl) and PLRG1ΔCNS mice. Shown is DAPI (top; nucleus) and TUNEL (bottom) staining for control (Ctrl) and PLRG1ΔCNS tissue of the same brain sections. Scale bars, 100 μm (top) and 50 μm (bottom). (D) Western blot analysis of total cellular protein extracts from control (Ctrl) and PLRG1ΔCNS brain tissue probed with respective antibodies. β-Actin served as a loading control.
FIG. 9.
FIG. 9.
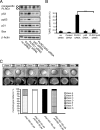
Apoptosis resulting from PLRG1 deficiency is p53 dependent. (A) Western blot analysis of MEFs left untreated or treated with control, PLRG1, p53, and PLRG1/p53 siRNA oligonucleotides and probed with the respective antibodies. β-Actin served as a loading control. (B) Determination of apoptosis by TUNEL assay in MEFs. The percentage of TUNEL-positive cells in MEFs that were left untransfected or were transfected with control, PLRG1, p53, and PLRG1/p53 siRNA oligonucleotides are shown. Values represent means ± standard errors of the means from three independent experiments (***, P < 0.001). (C) Effect of MO-mediated plrg1 knockdown in zebrafish. Upper panel, morphological consequence of plrg1 knockdown. The upper row of images are from phase-contrast microscopy, and the lower row of images show the acridine orange staining of apoptotic cells. Lower panel, summary of the occurrence of different degrees of morphological changes and the degree of apoptosis resulting from the injection of plrg1 MO or the simultaneous injection of plrg1/p53 MO at the indicated concentrations. Note the rescue of the plrg1 MO-induced phenotype by p53 MO.

Similar articles

Cited by

References

    1. Agrelo, R., W. H. Cheng, F. Setien, S. Ropero, J. Espada, M. F. Fraga, M. Herranz, M. F. Paz, M. Sanchez-Cespedes, M. J. Artiga, D. Guerrero, A. Castells, C. von Kobbe, V. A. Bohr, and M. Esteller. 2006. Epigenetic inactivation of the premature aging Werner syndrome gene in human cancer. Proc. Natl. Acad. Sci. USA 1038822-8827. - PMC - PubMed
    1. Ajuh, P., B. Kuster, K. Panov, J. C. Zomerdijk, M. Mann, and A. I. Lamond. 2000. Functional analysis of the human CDC5L complex and identification of its components by mass spectrometry. EMBO J. 196569-6581. - PMC - PubMed
    1. Ajuh, P., and A. I. Lamond. 2003. Identification of peptide inhibitors of pre-mRNA splicing derived from the essential interaction domains of CDC5L and PLRG1. Nucleic Acids Res. 316104-6116. - PMC - PubMed
    1. Ajuh, P., J. Sleeman, J. Chusainow, and A. I. Lamond. 2001. A direct interaction between the carboxyl-terminal region of CDC5L and the WD40 domain of PLRG1 is essential for pre-mRNA splicing. J. Biol. Chem. 27642370-42381. - PubMed
    1. Albers, M., A. Diment, M. Muraru, C. S. Russell, and J. D. Beggs. 2003. Identification and characterization of Prp45p and Prp46p, essential pre-mRNA splicing factors. RNA 9138-150. - PMC - PubMed

Publication types

MeSH terms