

Predictive value of pharmacokinetics-adjusted phenotypic susceptibility on response to ritonavir-enhanced protease inhibitors (PIs) in human immunodeficiency virus-infected subjects failing prior PI therapy
- PMID: 19307363
- PMCID: PMC2687257
- DOI: 10.1128/AAC.01387-08
Predictive value of pharmacokinetics-adjusted phenotypic susceptibility on response to ritonavir-enhanced protease inhibitors (PIs) in human immunodeficiency virus-infected subjects failing prior PI therapy
Abstract
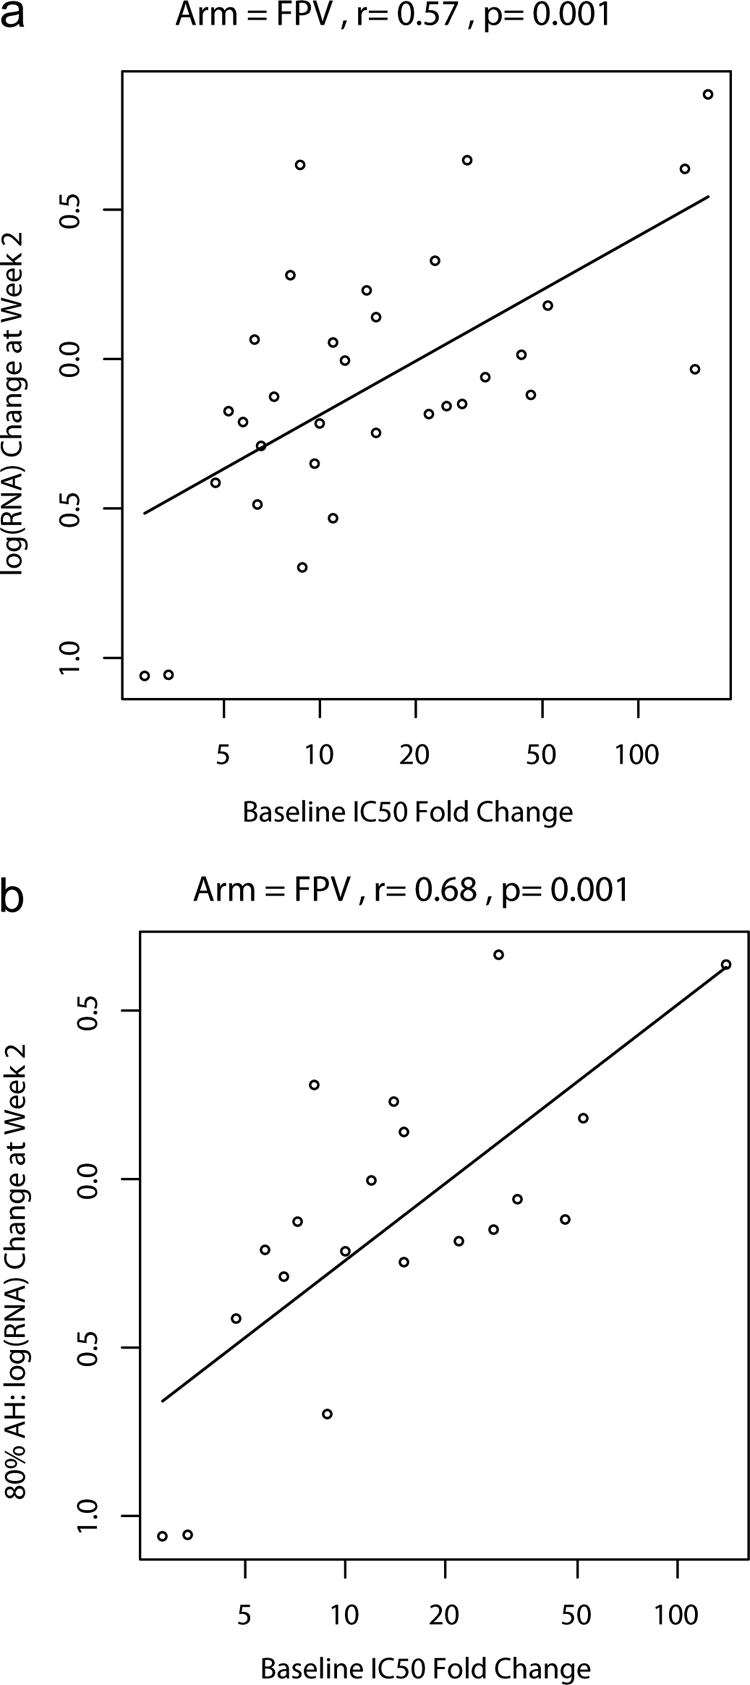
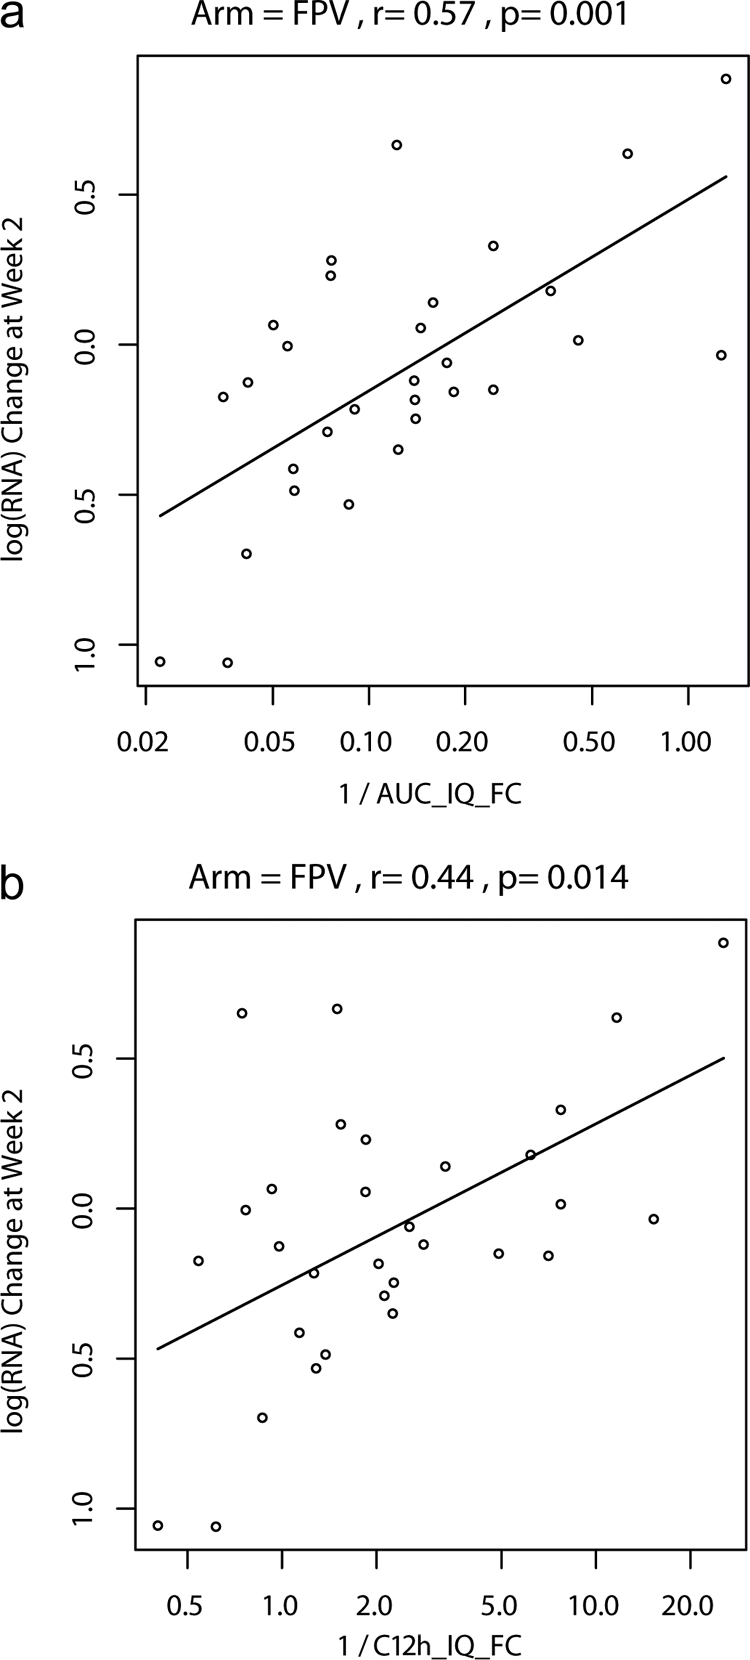
The activities of protease inhibitors in vivo may depend on plasma concentrations and viral susceptibility. This nonrandomized, open-label study evaluated the relationship of the inhibitory quotient (IQ [the ratio of drug exposure to viral phenotypic susceptibility]) to the human immunodeficiency virus type 1 (HIV-1) viral load (VL) change for ritonavir-enhanced protease inhibitors (PIs). Subjects on PI-based regimens replaced their PIs with ritonavir-enhanced indinavir (IDV/r) 800/200 mg, fosamprenavir (FPV/r) 700/100 mg, or lopinavir (LPV/r) 400/200 mg twice daily. Pharmacokinetics were assessed at day 14; follow-up lasted 24 weeks. Associations between IQ and VL changes were examined. Fifty-three subjects enrolled, 12 on IDV/r, 33 on FPV/r, and 8 on LPV/r. Median changes (n-fold) (FC) of 50% inhibitory concentrations (IC(50)s) to the study PI were high. Median 2-week VL changes were -0.7, -0.1, and -1.0 log(10) for IDV/r, FPV/r, and LPV/r. With FPV/r, correlations between the IQ and the 2-week change in VL were significant (Spearman's r range, -0.39 to -0.50; P < or = 0.029). The strongest correlation with response to FPV/r was the IC(50) FC (r = 0.57; P = 0.001), which improved when only adherent subjects were included (r = 0.68; P = 0.001). In multivariable analyses of the FPV/r arm that included FC, one measure of the drug concentration, corresponding IQ, baseline VL, and CD4, the FC to FPV was the only significant predictor of VL decline (P < 0.001). In exploratory analyses of all arms, the area under the concentration-time curve IQ was correlated with the week 2 VL change (r = -0.72; P < 0.001). In conclusion, in PI-experienced subjects with highly resistant HIV-1, short-term VL responses to RTV-enhanced FPV/r correlated best with baseline susceptibility. The IQ improved correlation in analyses of all arms where a greater range of virologic responses was observed.
Figures
References
-
- Acosta, E. P., H. Wu, S. M. Hammer, S. Yu, D. R. Kuritzkes, A. Walawander, J. J. Eron, C. J. Fichtenbaum, C. Pettinelli, D. Neath, E. Ferguson, A. J. Saah, and J. G. Gerber. 2004. Comparison of two indinavir/ritonavir regimens in the treatment of HIV-infected individuals. J. Acquir. Immune Defic. Syndr. 37:1358-1366. - PubMed
-
- Anderson, P. L., R. C. Brundage, L. Bushman, T. N. Kakuda, R. P. Remmel, and C. V. Fletcher. 2000. Indinavir plasma protein binding in HIV-1-infected adults. AIDS 14:2293-2297. - PubMed
-
- Barrail, A., C. Le Tiec, S. Paci-Bonaventure, V. Furlan, I. Vincent, and A. M. Taburet. 2006. Determination of amprenavir total and unbound concentrations in plasma by high-performance liquid chromatography and ultrafiltration. Ther. Drug Monit. 28:89-94. - PubMed
-
- Barrail-Tran A., L. Morand-Joubert, G. Poizat, G. Raguin, C. Le Tiec, F. Clavel, E. Dam, G. Chêne, P. M. Girard, A. M. Taburet, and the Puzzle-1 (ANRS 104) Study Group. 2008. Predictive values of the human immunodeficiency virus phenotype and genotype and of amprenavir and lopinavir inhibitory quotients in heavily pretreated patients on a ritonavir-boosted dual-protease-inhibitor regimen. Antimicrob. Agents Chemother. 52:1642-1646. - PMC - PubMed
-
- Boffito, M., E. Acosta, D. Burger, C. V. Fletcher, C. Flexner, R. Garaffo, G. Gatti, M. Kurowski, C. F. Perno, G. Peytavin, M. Regazzi, and D. Back. 2005. Current status and future prospects of therapeutic drug monitoring and applied clinical pharmacology in antiretroviral therapy. Antivir. Ther. 10:375-392. - PubMed
Publication types
MeSH terms
Substances
Grants and funding
- U01 AI069423/AI/NIAID NIH HHS/United States
- AI46370/AI/NIAID NIH HHS/United States
- 5U01AI069428-02/AI/NIAID NIH HHS/United States
- K24 AI064086/AI/NIAID NIH HHS/United States
- 1U01AI/AI/NIAID NIH HHS/United States
- U01 AI046376/AI/NIAID NIH HHS/United States
- U01 AI069450/AI/NIAID NIH HHS/United States
- AI 69432/AI/NIAID NIH HHS/United States
- M01 RR000051/RR/NCRR NIH HHS/United States
- UM1 AI069556/AI/NIAID NIH HHS/United States
- UM1 AI069532/AI/NIAID NIH HHS/United States
- 5 U01 A1069415-02/PHS HHS/United States
- UO1AL32782/PHS HHS/United States
- U01 AI069477/AI/NIAID NIH HHS/United States
- AI50410/AI/NIAID NIH HHS/United States
- AI68634/AI/NIAID NIH HHS/United States
- AI68636/AI/NIAID NIH HHS/United States
- UM1 AI069423/AI/NIAID NIH HHS/United States
- 5U01 AI069484-02/AI/NIAID NIH HHS/United States
- M01 RR000096/RR/NCRR NIH HHS/United States
- M01 RR000046/RR/NCRR NIH HHS/United States
- RR024977/RR/NCRR NIH HHS/United States
- UM1 AI069432/AI/NIAID NIH HHS/United States
- AI069532/AI/NIAID NIH HHS/United States
- AI-27665/AI/NIAID NIH HHS/United States
- AI38858/AI/NIAID NIH HHS/United States
- U01 AI069484/AI/NIAID NIH HHS/United States
- AI36214/AI/NIAID NIH HHS/United States
- U01 AI069439/AI/NIAID NIH HHS/United States
- U01 AI069556/AI/NIAID NIH HHS/United States
- M01-RR00096/RR/NCRR NIH HHS/United States
- RR00051/RR/NCRR NIH HHS/United States
- U01 AI069428/AI/NIAID NIH HHS/United States
- KL2 RR024977/RR/NCRR NIH HHS/United States
- U01 AI069532/AI/NIAID NIH HHS/United States
- UM1 AI069439/AI/NIAID NIH HHS/United States
- AI069439/AI/NIAID NIH HHS/United States
- UM1 AI069484/AI/NIAID NIH HHS/United States
- UM1 AI068634/AI/NIAID NIH HHS/United States
- UM1 AI069477/AI/NIAID NIH HHS/United States
- U01 AI069432/AI/NIAID NIH HHS/United States
- U01 AI038858/AI/NIAID NIH HHS/United States
- U01 AI046370/AI/NIAID NIH HHS/United States
- U01 AI068636/AI/NIAID NIH HHS/United States
- AI64086/AI/NIAID NIH HHS/United States
- AI069556-02/AI/NIAID NIH HHS/United States
- P30 AI036214/AI/NIAID NIH HHS/United States
- U01 AI025859/AI/NIAID NIH HHS/United States
- UM1 AI069450/AI/NIAID NIH HHS/United States
- AI69450/AI/NIAID NIH HHS/United States
- AI69423-01/AI/NIAID NIH HHS/United States
- U01 AI027665/AI/NIAID NIH HHS/United States
- AI069477/AI/NIAID NIH HHS/United States
- RR00046/RR/NCRR NIH HHS/United States
- P30 AI050410/AI/NIAID NIH HHS/United States
- AI025859/AI/NIAID NIH HHS/United States
- U01 AI068634/AI/NIAID NIH HHS/United States
- UM1 AI068636/AI/NIAID NIH HHS/United States
LinkOut - more resources
Full Text Sources
Medical
Research Materials
Miscellaneous
