

Detection and quantification of left atrial structural remodeling with delayed-enhancement magnetic resonance imaging in patients with atrial fibrillation
- PMID: 19307477
- PMCID: PMC2725019
- DOI: 10.1161/CIRCULATIONAHA.108.811877
Detection and quantification of left atrial structural remodeling with delayed-enhancement magnetic resonance imaging in patients with atrial fibrillation
Abstract
Background: Atrial fibrillation (AF) is associated with diffuse left atrial fibrosis and a reduction in endocardial voltage. These changes are indicators of AF severity and appear to be predictors of treatment outcome. In this study, we report the utility of delayed-enhancement magnetic resonance imaging (DE-MRI) in detecting abnormal atrial tissue before radiofrequency ablation and in predicting procedural outcome.
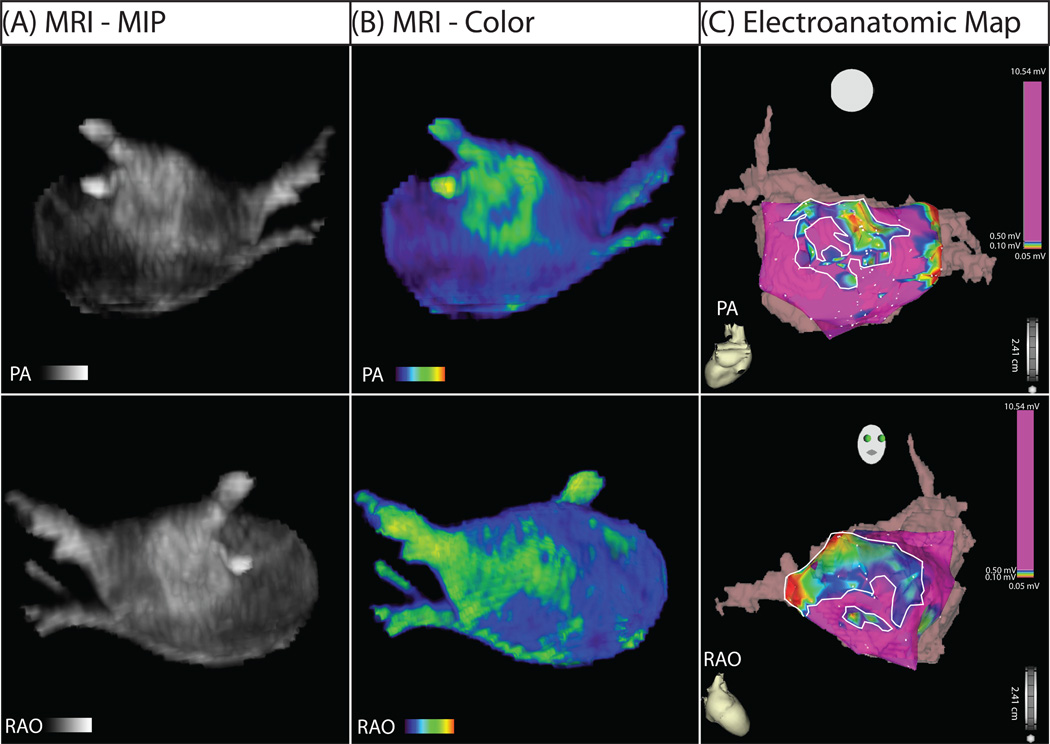
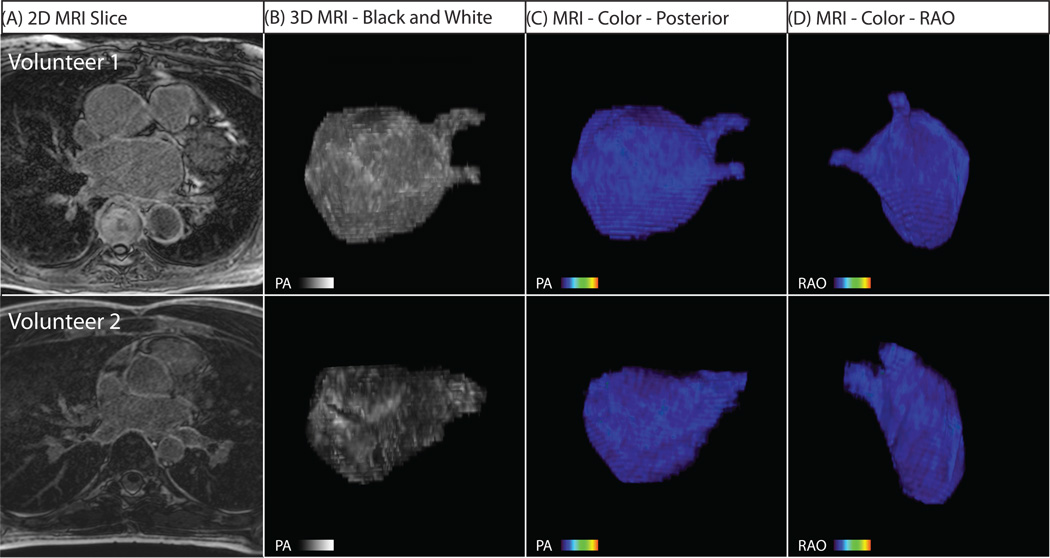
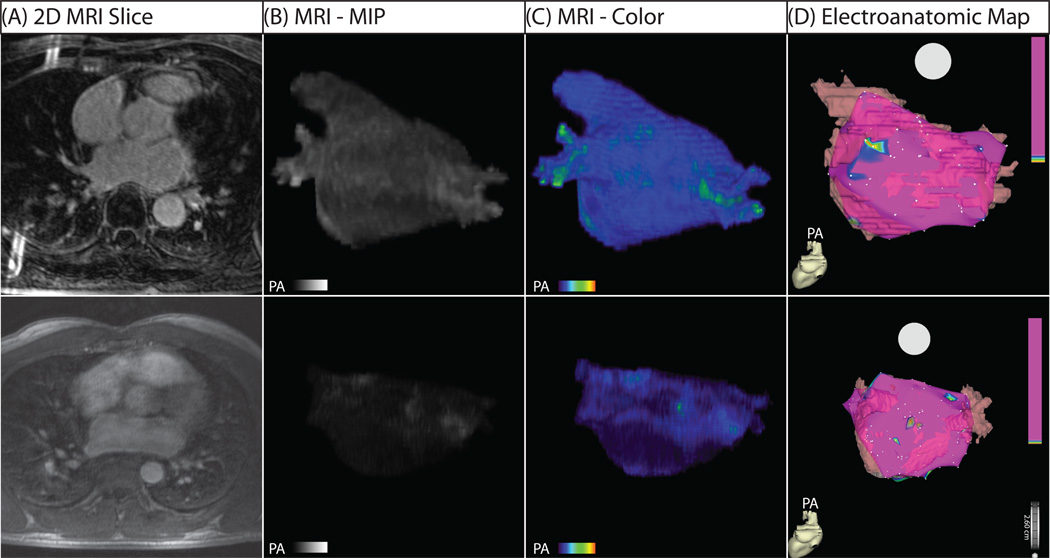
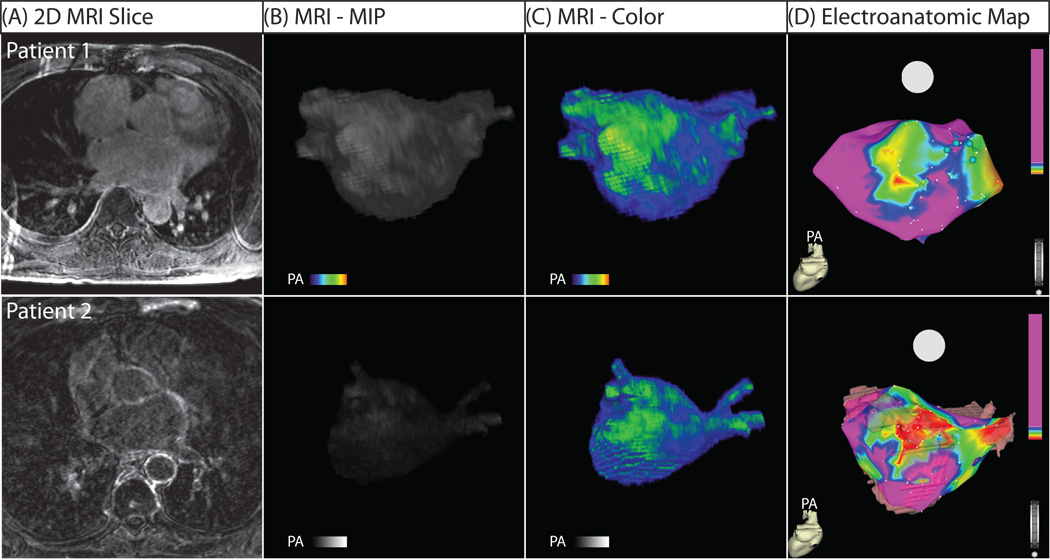
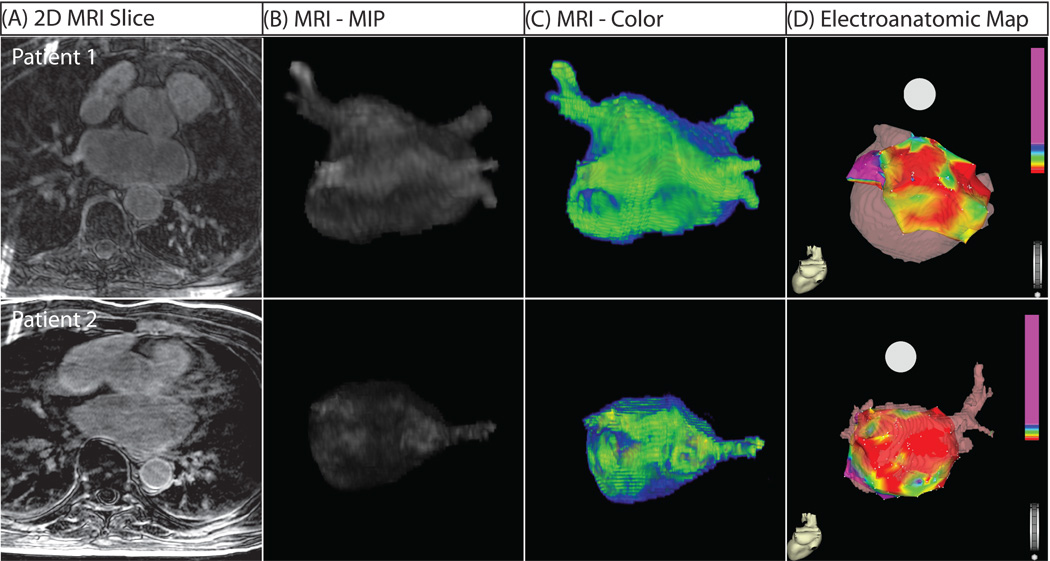
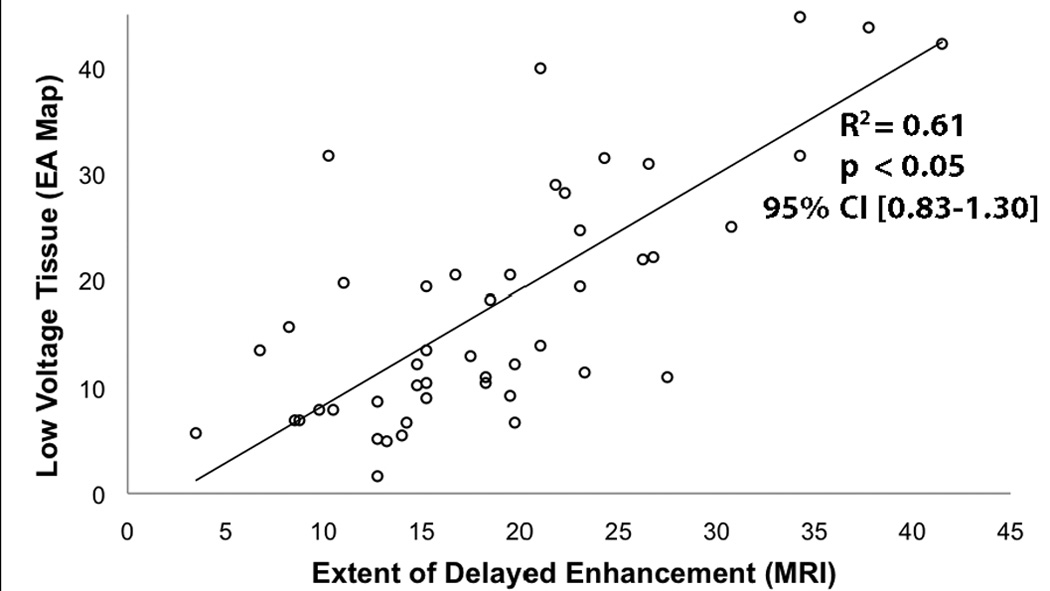
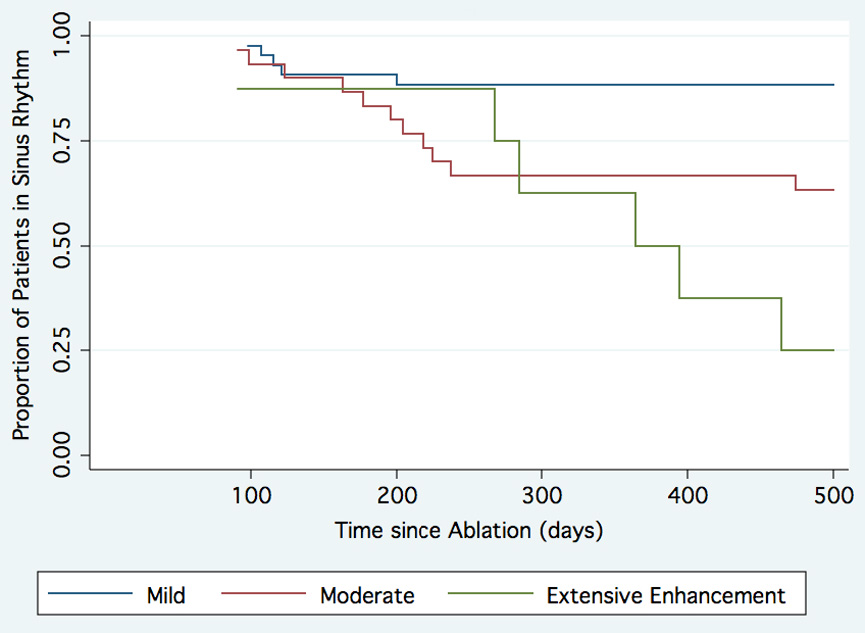
Methods and results: Eighty-one patients presenting for pulmonary vein antrum isolation for treatment of AF underwent 3-dimensional DE-MRI of the left atrium before the ablation. Six healthy volunteers also were scanned. DE-MRI images were manually segmented to isolate the left atrium, and custom software was implemented to quantify the spatial extent of delayed enhancement, which was then compared with the regions of low voltage from electroanatomic maps from the pulmonary vein antrum isolation procedure. Patients were assessed for AF recurrence at least 6 months after pulmonary vein antrum isolation, with an average follow-up of 9.6+/-3.7 months (range, 6 to 19 months). On the basis of the extent of preablation enhancement, 43 patients were classified as having minimal enhancement (average enhancement, 8.0+/-4.2%), 30 as having moderate enhancement (21.3+/-5.8%), and 8 as having extensive enhancement (50.1+/-15.4%). The rate of AF recurrence was 6 patients (14.0%) with minimal enhancement, 13 (43.3%) with moderate enhancement, and 6 (75%) with extensive enhancement (P<0.001).
Conclusions: DE-MRI provides a noninvasive means of assessing left atrial myocardial tissue in patients suffering from AF and might provide insight into the progress of the disease. Preablation DE-MRI holds promise for predicting responders to AF ablation and may provide a metric of overall disease progression.
Conflict of interest statement
Figures
References
-
- Haissaguerre M, Jais P, Shah DC, Takahashi A, Hocini M, Quiniou G, Garrigue S, Le Mouroux A, Le Metayer P, Clementy J. Spontaneous initiation of atrial fibrillation by ectopic beats originating in the pulmonary veins. The New England journal of medicine. 1998;339:659–666. - PubMed
-
- Marrouche NF, Martin DO, Wazni O, Gillinov AM, Klein A, Bhargava M, Saad E, Bash D, Yamada H, Jaber W, Schweikert R, Tchou P, Abdul-Karim A, Saliba W, Natale A. Phased-array intracardiac echocardiography monitoring during pulmonary vein isolation in patients with atrial fibrillation: impact on outcome and complications. Circulation. 2003;107:2710–2716. - PubMed
-
- Marrouche NF, Dresing T, Cole C, Bash D, Saad E, Balaban K, Pavia SV, Schweikert R, Saliba W, Abdul-Karim A, Pisano E, Fanelli R, Tchou P, Natale A. Circular mapping and ablation of the pulmonary vein for treatment of atrial fibrillation: impact of different catheter technologies. Journal of the American College of Cardiology. 2002;40:464–474. - PubMed
-
- Pappone C, Oreto G, Rosanio S, Vicedomini G, Tocchi M, Gugliotta F, Salvati A, Dicandia C, Calabro MP, Mazzone P, Ficarra E, Di Gioia C, Gulletta S, Nardi S, Santinelli V, Benussi S, Alfieri O. Atrial electroanatomic remodeling after circumferential radiofrequency pulmonary vein ablation: efficacy of an anatomic approach in a large cohort of patients with atrial fibrillation. Circulation. 2001;104:2539–2544. - PubMed
-
- Oral H, Pappone C, Chugh A, Good E, Bogun F, Pelosi F, Jr, Bates ER, Lehmann MH, Vicedomini G, Augello G, Agricola E, Sala S, Santinelli V, Morady F. Circumferential pulmonary-vein ablation for chronic atrial fibrillation. The New England journal of medicine. 2006;354:934–941. - PubMed
Publication types
MeSH terms
Substances
Grants and funding
LinkOut - more resources
Full Text Sources
Other Literature Sources
Medical
