

Longitudinal trajectories of non-rapid eye movement delta and theta EEG as indicators of adolescent brain maturation
- PMID: 19307577
- PMCID: PMC2664015
- DOI: 10.1073/pnas.0812947106
Longitudinal trajectories of non-rapid eye movement delta and theta EEG as indicators of adolescent brain maturation
Abstract
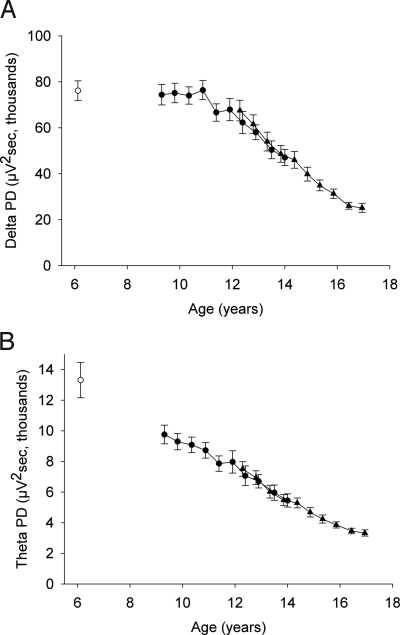
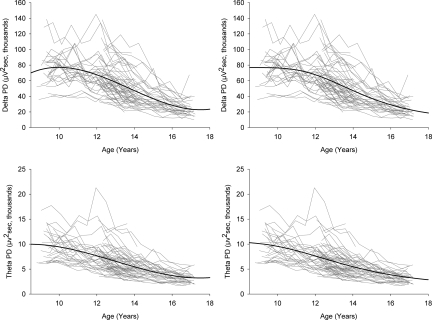
It is now recognized that extensive maturational changes take place in the human brain during adolescence, and that the trajectories of these changes are best studied longitudinally. We report the first longitudinal study of the adolescent decline in non-rapid eye movement (NREM) delta (1-4 Hz) and theta (4-8 Hz) EEG. Delta and theta are the homeostatic frequencies of human sleep. We recorded sleep EEG in 9- and 12-year-old cohorts twice yearly over a 5-year period. Delta power density (PD) was unchanged between age 9 and 11 years and then fell precipitously, decreasing by 66% between age 11 and 16.5 years (P < .000001). The decline in theta PD began significantly earlier than that in delta PD and also was very steep (by 60%) between age 11 and 16.5 years (P < .000001). These data suggest that age 11-16.5 years is a critically important maturational period for the brain processes that underlie homeostatic NREM EEG, a finding not suggested in previous cross-sectional data. We hypothesize that these EEG changes reflect synaptic pruning. Comparing our data with published longitudinal declines in MRI-estimated cortical thickness suggests the theta age curve parallels the earlier maturational thinning in 3-layer cortex, whereas the delta curve tracks the later changes in 5-layer cortex. This comparison also reveals that adolescent declines in NREM delta and theta are substantially larger than decreases in cortical thickness (>60% vs. <20%). The magnitude, interindividual difference, and tight link to age of these EEG changes indicate that they provide excellent noninvasive tools for investigating neurobehavioral correlates of adolescent brain maturation.
Conflict of interest statement
The authors declare no conflict of interest.
Figures
References
-
- Feinberg I, Thode HC, Chugani HT, March JD. Gamma distribution model describes maturational curves for delta wave amplitude, cortical metabolic rate and synaptic density. J Theor Biol. 1990;142:149–161. - PubMed
-
- Feinberg I. Schizophrenia: Caused by a fault in programmed synaptic elimination during adolescence? J Psychiatr Res. 1982;17:319–334. - PubMed
-
- Huttenlocher PR. Synaptic density in human frontal cortex: Developmental changes and effects of aging. Brain Res. 1979;163:195–205. - PubMed
-
- Jernigan TL, Trauner DA, Hesselink JR, Tallal P. Maturation of human cerebrum observed in vivo during adolesence. Brain. 1991;114:2037–2049. - PubMed
Publication types
MeSH terms
Grants and funding
LinkOut - more resources
Full Text Sources
