

Galpha12/13 regulate epiboly by inhibiting E-cadherin activity and modulating the actin cytoskeleton
- PMID: 19307601
- PMCID: PMC2664974
- DOI: 10.1083/jcb.200805148
Galpha12/13 regulate epiboly by inhibiting E-cadherin activity and modulating the actin cytoskeleton
Abstract
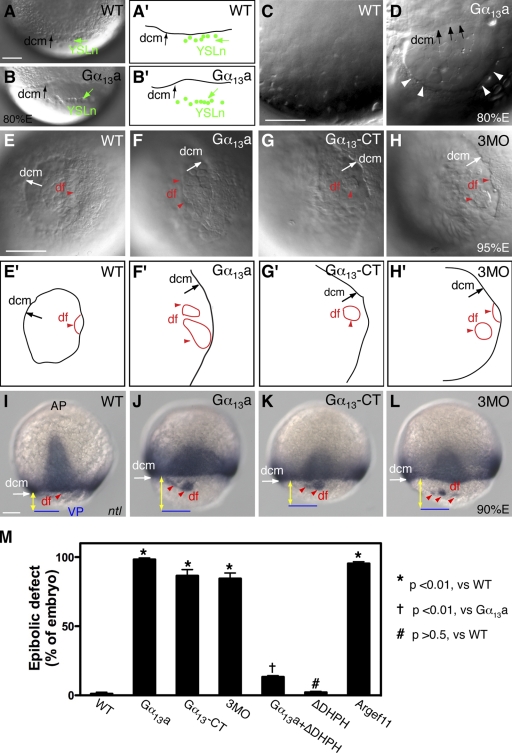
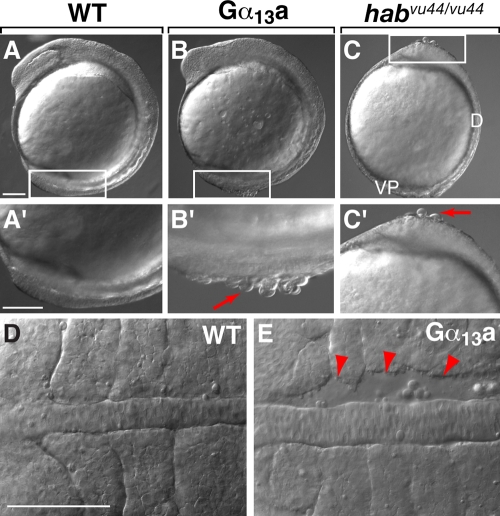
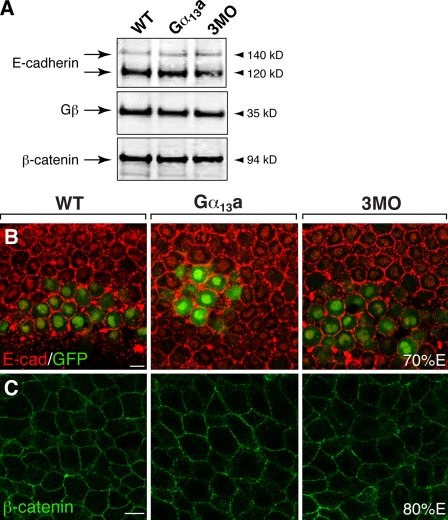
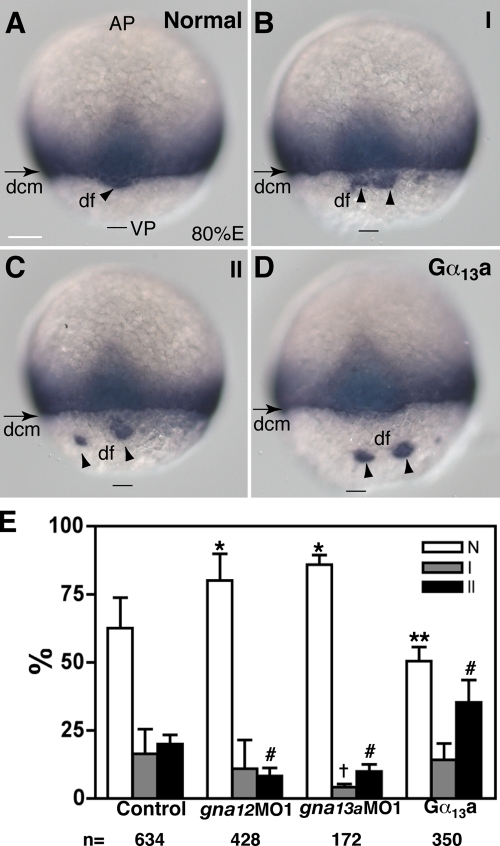
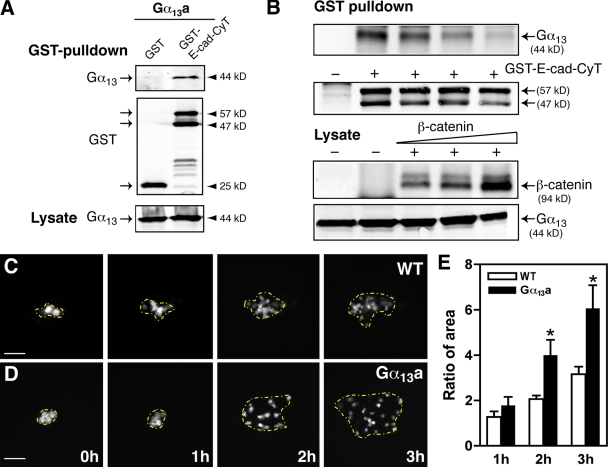
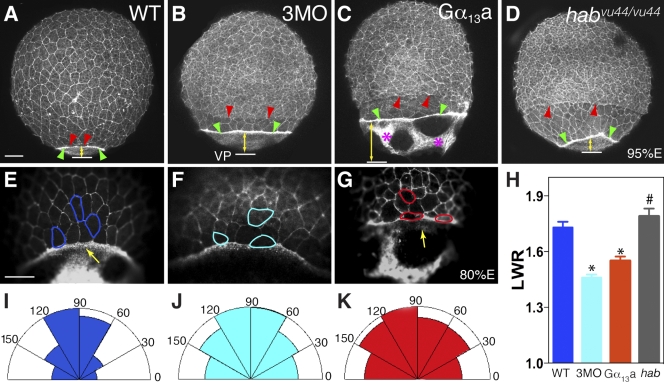
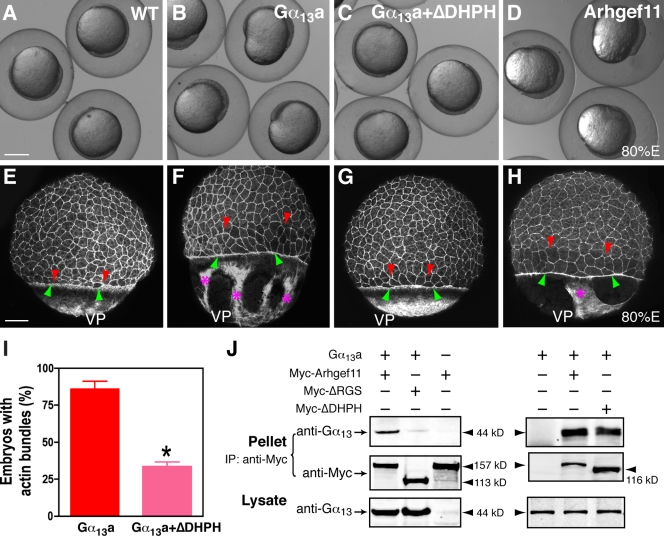
Epiboly spreads and thins the blastoderm over the yolk cell during zebrafish gastrulation, and involves coordinated movements of several cell layers. Although recent studies have begun to elucidate the processes that underlie these epibolic movements, the cellular and molecular mechanisms involved remain to be fully defined. Here, we show that gastrulae with altered Galpha(12/13) signaling display delayed epibolic movement of the deep cells, abnormal movement of dorsal forerunner cells, and dissociation of cells from the blastoderm, phenocopying e-cadherin mutants. Biochemical and genetic studies indicate that Galpha(12/13) regulate epiboly, in part by associating with the cytoplasmic terminus of E-cadherin, and thereby inhibiting E-cadherin activity and cell adhesion. Furthermore, we demonstrate that Galpha(12/13) modulate epibolic movements of the enveloping layer by regulating actin cytoskeleton organization through a RhoGEF/Rho-dependent pathway. These results provide the first in vivo evidence that Galpha(12/13) regulate epiboly through two distinct mechanisms: limiting E-cadherin activity and modulating the organization of the actin cytoskeleton.
Figures
Similar articles
-
Prmt7 regulates epiboly and gastrulation cell movements by facilitating syntenin.Acta Biochim Biophys Sin (Shanghai). 2018 Dec 1;50(12):1280-1287. doi: 10.1093/abbs/gmy136. Acta Biochim Biophys Sin (Shanghai). 2018. PMID: 30383201
-
Loss of cofilin 1 disturbs actin dynamics, adhesion between enveloping and deep cell layers and cell movements during gastrulation in zebrafish.PLoS One. 2010 Dec 22;5(12):e15331. doi: 10.1371/journal.pone.0015331. PLoS One. 2010. PMID: 21203473 Free PMC article.
-
Rac1 signalling coordinates epiboly movement by differential regulation of actin cytoskeleton in zebrafish.Biochem Biophys Res Commun. 2017 Aug 26;490(3):1059-1065. doi: 10.1016/j.bbrc.2017.06.165. Epub 2017 Jun 28. Biochem Biophys Res Commun. 2017. PMID: 28668387
-
Mechanisms of zebrafish epiboly: A current view.Curr Top Dev Biol. 2020;136:319-341. doi: 10.1016/bs.ctdb.2019.07.001. Epub 2019 Aug 27. Curr Top Dev Biol. 2020. PMID: 31959293 Review.
-
Zebrafish epiboly: mechanics and mechanisms.Int J Dev Biol. 2010;54(8-9):1213-28. doi: 10.1387/ijdb.093028sl. Int J Dev Biol. 2010. PMID: 20712002 Review.
Cited by
-
GPR56/ADGRG1 regulates development and maintenance of peripheral myelin.J Exp Med. 2018 Mar 5;215(3):941-961. doi: 10.1084/jem.20161714. Epub 2018 Jan 24. J Exp Med. 2018. PMID: 29367382 Free PMC article.
-
Tumor suppressor Lzap regulates cell cycle progression, doming, and zebrafish epiboly.Dev Dyn. 2011 Jun;240(6):1613-25. doi: 10.1002/dvdy.22644. Epub 2011 Apr 26. Dev Dyn. 2011. PMID: 21523853 Free PMC article.
-
S1pr2/Gα13 signaling controls myocardial migration by regulating endoderm convergence.Development. 2013 Feb;140(4):789-99. doi: 10.1242/dev.085340. Epub 2013 Jan 14. Development. 2013. PMID: 23318642 Free PMC article.
-
Toddler: an embryonic signal that promotes cell movement via Apelin receptors.Science. 2014 Feb 14;343(6172):1248636. doi: 10.1126/science.1248636. Epub 2014 Jan 9. Science. 2014. PMID: 24407481 Free PMC article.
-
Heterotrimeric G protein signaling outside the realm of seven transmembrane domain receptors.Mol Pharmacol. 2010 Jul;78(1):12-8. doi: 10.1124/mol.110.063453. Epub 2010 Apr 19. Mol Pharmacol. 2010. PMID: 20404072 Free PMC article. Review.
References
-
- Akhter SA, Luttrell LM, Rockman HA, Iaccarino G, Lefkowitz RJ, Koch WJ. Targeting the receptor-Gq interface to inhibit in vivo pressure overload myocardial hypertrophy. Science. 1998;280:574–577. - PubMed
-
- Arai K., Maruyama Y., Nishida M., Tanabe S., Takagahara S., Kozasa T., Mori Y., Nagao T., and Kurose H. Differential requirement of Gα12, Gα13, Gαq, and Gβγ for endothelin-1-induced c-Jun NH2-terminal kinase and extracellular signal-regulated kinase activation. Mol Pharmacol. 2003. 63: 478–488 - PubMed
-
- Arendt D., Nubler-Jung K. 1999. Rearranging gastrulation in the name of yolk: evolution of gastrulation in yolk-rich amniote eggs.Mech. Dev. 81: 3–22 - PubMed
-
- Babb S.G., Marrs J.A. 2004. E-cadherin regulates cell movements and tissue formation in early zebrafish embryos.Dev. Dyn. 230: 263–277 - PubMed
-
- Babb S.G., Barnett J., Doedens A.L., Cobb N., Liu Q., Sorkin B.C., Yelick P.C., Raymond P.A., Marrs J.A. 2001. Zebrafish E-cadherin: expression during early embryogenesis and regulation during brain development.Dev. Dyn. 221: 231–237 - PubMed
Publication types
MeSH terms
Substances
Grants and funding
- T32 HD007502/HD/NICHD NIH HHS/United States
- HL 60678/HL/NHLBI NIH HHS/United States
- K99 RR024119/RR/NCRR NIH HHS/United States
- EY 10291/EY/NEI NIH HHS/United States
- 1K99 RR 024119-01/RR/NCRR NIH HHS/United States
- EY 07135-13/EY/NEI NIH HHS/United States
- P01 HL060678/HL/NHLBI NIH HHS/United States
- GM 77770/GM/NIGMS NIH HHS/United States
- T32 EY007135/EY/NEI NIH HHS/United States
- 1S10 RR 015682/RR/NCRR NIH HHS/United States
- R01 GM055101/GM/NIGMS NIH HHS/United States
- R01 EY010291/EY/NEI NIH HHS/United States
- R01 GM077770/GM/NIGMS NIH HHS/United States
LinkOut - more resources
Full Text Sources
Other Literature Sources
Molecular Biology Databases
