. 2009 Dec;41(6):742-55.
doi: 10.1165/rcmb.2008-0157OC. Epub 2009 Mar 23.

Leukocyte elastase induces lung epithelial apoptosis via a PAR-1-, NF-kappaB-, and p53-dependent pathway

Affiliations

Leukocyte elastase induces lung epithelial apoptosis via a PAR-1-, NF-kappaB-, and p53-dependent pathway

Tomoko Suzuki et al. Am J Respir Cell Mol Biol. 2009 Dec.

Abstract

Leukocyte elastase induces apoptosis of lung epithelial cells via alterations in mitochondrial permeability, but the signaling pathways regulating this response remain uncertain. Here we investigated the involvement of proteinase-activated receptor-1 (PAR-1), the transcription factor NF-kappaB, and the protooncogene p53 in this pathway. Elastase-induced apoptosis of lung epithelial cells correlated temporally with activation of NF-kappaB, phosphorylation, and nuclear translocation of p53, increased p53 up-regulated modulator of apoptosis (PUMA) expression, and mitochondrial translocation of Bax resulting in enhanced permeability. Elastase-induced apoptosis was also prevented by pharmacologic inhibitors of NF-kappaB and p53 and by short interfering RNA knockdown of PAR-1, p53, or PUMA. These inhibitors prevented elastase-induced PUMA expression, mitochondrial translocation of Bax, increased mitochondrial permeability, and attenuated apoptosis. NF-kappaB inhibitors also reduced p53 phosphorylation. We conclude that elastase-induced apoptosis of lung epithelial cells is mediated by a PAR-1-triggered pathway involving activation of NF-kappaB and p53, and a PUMA- and Bax-dependent increase in mitochondrial permeability leading to activation of distal caspases. Further, p53 contributes to elastase-induced apoptosis by both transcriptional and post-transcriptional mechanisms.


Figures
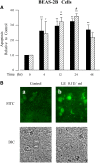
Figure 1.
Figure 1.
Leukocyte elastase (LE) induces lung epithelial apoptosis in a time-dependent manner. Cell death detection assay (A, C) and cleaved caspase-3 staining (B, D), were used for the detection of apoptosis. Two different lung epithelial cell types, BEAS-2B cells (A and B), and HSAE cells (C and D) were used. In experiments with HSAE cells, cells in the supernatant were sedimented using a cytocentrifuge and then stained as above. The graphs (A, C) represent the absorbance values relative to control (buffer). The solid bars represent 0.1 U/ml of LE, and the hatched bars represent 0.3 U/ml of human LE. Values are mean ± SD; *P < 0.05 and **P < 0.01 compared with control, and +,#P < 0.05 compared with each concentration of LE treatment. (A) n = 8. (C) n = 4. For cleaved caspase-3 staining (B, D), apoptotic cells are shown in green. Representative data from 1 of 4 experiments are shown.
Figure 1.
Figure 1.
Leukocyte elastase (LE) induces lung epithelial apoptosis in a time-dependent manner. Cell death detection assay (A, C) and cleaved caspase-3 staining (B, D), were used for the detection of apoptosis. Two different lung epithelial cell types, BEAS-2B cells (A and B), and HSAE cells (C and D) were used. In experiments with HSAE cells, cells in the supernatant were sedimented using a cytocentrifuge and then stained as above. The graphs (A, C) represent the absorbance values relative to control (buffer). The solid bars represent 0.1 U/ml of LE, and the hatched bars represent 0.3 U/ml of human LE. Values are mean ± SD; *P < 0.05 and **P < 0.01 compared with control, and +,#P < 0.05 compared with each concentration of LE treatment. (A) n = 8. (C) n = 4. For cleaved caspase-3 staining (B, D), apoptotic cells are shown in green. Representative data from 1 of 4 experiments are shown.
Figure 2.
Figure 2.
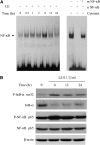
LE induces NF-κB DNA binding activity during lung epithelial apoptosis. (A) Electrophoretic mobility shift assay (EMSA) analysis of NF-κB DNA binding activity. The arrow indicates the NF-κB DNA binding complex. The positive control represents cytomix (10 ng/ml of TNF-α and IL-1β) treatment of lung epithelial cells. A sample of the positive control was incubated with unlabeled consensus (nNF-κB), or mutant oligonucleotide (mNF-κB), respectively. Representative data from 1 of 3 experiments are shown. (B) Western blot analysis of IκB-α and NF-κB. The first two panels illustrate IκB-α phosphorylation at serine 32, and total cellular levels of IκB-α, respectively. The third and fourth panels illustrate NF-κB p65 phosphorylation. The fifth panel illustrates α-actin levels as a control for protein loading. Representative data each from 1 of 5 experiments is shown. The first two panels are from one gel and the third through fifth panels are from another gel run in parallel. (C) EMSA analysis of NF-κB DNA binding activity after treatment of cells with the PAR-1 activating peptide (PAR-1AP) or control peptide. The arrow indicates the NF-κB DNA binding complex. Representative data from 1 of 3 experiments are shown. (D) Western analysis of phosphor- and total IκB-α in cells treated with the PAR-1AP or control peptide. β-actin is used as a control for protein loading. (E) Supershift EMSA for p65, p50, p52, Rel B, and c-Rel illustrating DNA binding complexes 4 hours after treatment with LE. The arrow indicates the super-shifted complexes. Representative data each from 1 of 3 experiments are shown. (F) Treatment of BEAS-2B cells with PAR-1 but not control siRNA results in significant diminution of PAR-1 protein levels as determined by Western analysis. The graph represents the mean ± SD of n = 3 experiments. (G) Inhibition of PAR-1 in BEAS-2B lung epithelial cells using siRNA prevents elastase-induced phosphorylation of IκB-α (upper bands) at serine 32 and degradation of total cellular levels of IκB-α (middle bands) as determined by Western blot analysis. Levels of β-actin are illustrated as a control for protein loading. (H, I) Densitometric analysis of Western blots of phosphor-IκB-α (H) and total cellular levels of IκB-α (I) normalized to β-actin from the experiment depicted in G. These data are representative of the results from 3 separate experiments conducted on different days with different passages of the epithelial cells. (J) Inhibition of PAR-1 using blocking antibodies prevents elastase-induced activation of NF-κB as determined using an NF-κB-luciferase reporter plasmid. Co-transfection with a Renilla luciferase plasmid was done as a control for transfection efficiency. These data are representative of the results from 3 separate experiments conducted on different days with different passages of the BEAS-2B epithelial cells.
Figure 2.
Figure 2.
LE induces NF-κB DNA binding activity during lung epithelial apoptosis. (A) Electrophoretic mobility shift assay (EMSA) analysis of NF-κB DNA binding activity. The arrow indicates the NF-κB DNA binding complex. The positive control represents cytomix (10 ng/ml of TNF-α and IL-1β) treatment of lung epithelial cells. A sample of the positive control was incubated with unlabeled consensus (nNF-κB), or mutant oligonucleotide (mNF-κB), respectively. Representative data from 1 of 3 experiments are shown. (B) Western blot analysis of IκB-α and NF-κB. The first two panels illustrate IκB-α phosphorylation at serine 32, and total cellular levels of IκB-α, respectively. The third and fourth panels illustrate NF-κB p65 phosphorylation. The fifth panel illustrates α-actin levels as a control for protein loading. Representative data each from 1 of 5 experiments is shown. The first two panels are from one gel and the third through fifth panels are from another gel run in parallel. (C) EMSA analysis of NF-κB DNA binding activity after treatment of cells with the PAR-1 activating peptide (PAR-1AP) or control peptide. The arrow indicates the NF-κB DNA binding complex. Representative data from 1 of 3 experiments are shown. (D) Western analysis of phosphor- and total IκB-α in cells treated with the PAR-1AP or control peptide. β-actin is used as a control for protein loading. (E) Supershift EMSA for p65, p50, p52, Rel B, and c-Rel illustrating DNA binding complexes 4 hours after treatment with LE. The arrow indicates the super-shifted complexes. Representative data each from 1 of 3 experiments are shown. (F) Treatment of BEAS-2B cells with PAR-1 but not control siRNA results in significant diminution of PAR-1 protein levels as determined by Western analysis. The graph represents the mean ± SD of n = 3 experiments. (G) Inhibition of PAR-1 in BEAS-2B lung epithelial cells using siRNA prevents elastase-induced phosphorylation of IκB-α (upper bands) at serine 32 and degradation of total cellular levels of IκB-α (middle bands) as determined by Western blot analysis. Levels of β-actin are illustrated as a control for protein loading. (H, I) Densitometric analysis of Western blots of phosphor-IκB-α (H) and total cellular levels of IκB-α (I) normalized to β-actin from the experiment depicted in G. These data are representative of the results from 3 separate experiments conducted on different days with different passages of the epithelial cells. (J) Inhibition of PAR-1 using blocking antibodies prevents elastase-induced activation of NF-κB as determined using an NF-κB-luciferase reporter plasmid. Co-transfection with a Renilla luciferase plasmid was done as a control for transfection efficiency. These data are representative of the results from 3 separate experiments conducted on different days with different passages of the BEAS-2B epithelial cells.
Figure 3.
Figure 3.
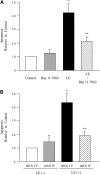
NF-κB inhibitors reduce lung epithelial apoptosis induced by LE. (A) Lung epithelial cells were pretreated with 5 μM of Bay11-7082 1 hour before exposure to LE for an additional 24 hours. (B) The cells were treated with 50 μg/ml of IκB kinase inactive control peptide (IκBK CP) or the IκB kinase inhibitory peptide (IκBK IP) 2 hours before exposure to LE for an additional 24 hours. The graphs represent apoptosis relative to LE treatment samples. Values are mean ± SD; *P < 0.05, **P < 0.01 compared with the control samples; ++P < 0.01 compared with the samples of LE treatment without Bay11-7082 or with IκB kinase control peptide (n = 8).
Figure 4.
Figure 4.
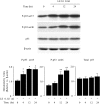
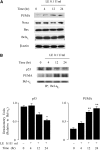
LE induces phosphorylation of p53. The first panel illustrates phosphorylation of p53 at serine 15, the second panel illustrates phosphorylation of p53 at serine 46, the third shows total p53, and the last panel represents α-actin (control) expression from BEAS-2B cells after treatment with LE using Western analysis. The graphs illustrate densitometry units normalized to the level of α-actin. Values represent mean ± SD. Representative data each from 1 of 5 experiments are shown.
Figure 5.
Figure 5.
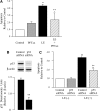
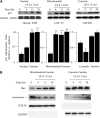
Role of p53 and NF-κB in elastase-induced lung epithelial apoptosis. (A) Cells were pre-treated with 50 μM of the p53 inhibitor PFT-α for 2 hours and then exposed to LE for an additional 24 hours. The graph represents apoptosis relative to LE-treated samples. Values are mean ± SD; *P < 0.05, **P < 0.01 compared with control samples without PFT-α; ++P < 0.01 compared with leukocyte elastase treated samples (n = 7). (B) BEAS-2B cells were transfected with 50 nM p53 or control siRNA followed by exposure to LE for an additional 24 hours. The upper panel illustrates p53 expression and the lower panel α-actin protein expression assessed by Western analysis. Representative data from 1 of 4 experiments are shown. The graph shows densitometry units normalized to levels of α-actin. The values are mean ± SD. (C) BEAS-2B cells were treated with LE 0.1 U/ml or buffer 24 hours after transfection with p53 or control siRNA. Values are mean ± SD; **P < 0.01 compared with control siRNA transfection and buffer only. ++P < 0.01 compared with control siRNA transfection followed by LE treatment (n = 6). (D) Treatment of cells with an NF-κB inhibitor reduces phosphorylation of p53 at serine 46. Cells were pretreated with 50 μg/ml of either IκBK CP or IκBK IP and then exposed to LE. Total cellular protein was collected for Western analysis. The left upper panel represents phosphorylation of p53 at serine 46 in the presence or absence of the IκBK CP. The upper right panel shows cells pretreated with the IκBK IP. α-actin levels are illustrated as a control. Representative data each from 1 of 3 experiments are shown. (E) An NF-κB inhibitor blocks elastase-induced increases in nuclear and cytosolic p53. Nuclear and cytosolic proteins were collected from cells pretreated with Bay11-7082 at 0, 4, 12, and 24 hours after treatment with 0.1 U/ml LE followed by Western analysis using anti-p53 antibody. Histone H2B was used as a control for the nuclear fraction and GAPDH was used as a control for the cytosolic fraction. Representative data from 1 of 3 experiments are shown. The graphs depict densitometric analysis normalized to the level of the protein markers of each fraction. The solid bars represent samples treated with 0.1 U/ml of leukocyte elastase, and the hatched bars represent samples pretreated 5 μM of Bay11-7082 before exposure to LE. Values are mean ± SD.
Figure 5.
Figure 5.
Role of p53 and NF-κB in elastase-induced lung epithelial apoptosis. (A) Cells were pre-treated with 50 μM of the p53 inhibitor PFT-α for 2 hours and then exposed to LE for an additional 24 hours. The graph represents apoptosis relative to LE-treated samples. Values are mean ± SD; *P < 0.05, **P < 0.01 compared with control samples without PFT-α; ++P < 0.01 compared with leukocyte elastase treated samples (n = 7). (B) BEAS-2B cells were transfected with 50 nM p53 or control siRNA followed by exposure to LE for an additional 24 hours. The upper panel illustrates p53 expression and the lower panel α-actin protein expression assessed by Western analysis. Representative data from 1 of 4 experiments are shown. The graph shows densitometry units normalized to levels of α-actin. The values are mean ± SD. (C) BEAS-2B cells were treated with LE 0.1 U/ml or buffer 24 hours after transfection with p53 or control siRNA. Values are mean ± SD; **P < 0.01 compared with control siRNA transfection and buffer only. ++P < 0.01 compared with control siRNA transfection followed by LE treatment (n = 6). (D) Treatment of cells with an NF-κB inhibitor reduces phosphorylation of p53 at serine 46. Cells were pretreated with 50 μg/ml of either IκBK CP or IκBK IP and then exposed to LE. Total cellular protein was collected for Western analysis. The left upper panel represents phosphorylation of p53 at serine 46 in the presence or absence of the IκBK CP. The upper right panel shows cells pretreated with the IκBK IP. α-actin levels are illustrated as a control. Representative data each from 1 of 3 experiments are shown. (E) An NF-κB inhibitor blocks elastase-induced increases in nuclear and cytosolic p53. Nuclear and cytosolic proteins were collected from cells pretreated with Bay11-7082 at 0, 4, 12, and 24 hours after treatment with 0.1 U/ml LE followed by Western analysis using anti-p53 antibody. Histone H2B was used as a control for the nuclear fraction and GAPDH was used as a control for the cytosolic fraction. Representative data from 1 of 3 experiments are shown. The graphs depict densitometric analysis normalized to the level of the protein markers of each fraction. The solid bars represent samples treated with 0.1 U/ml of leukocyte elastase, and the hatched bars represent samples pretreated 5 μM of Bay11-7082 before exposure to LE. Values are mean ± SD.
Figure 6.
Figure 6.
LE induces PUMA expression by lung epithelial cells. (A) Western analysis of PUMA, Noxa, Bax, and Bcl-xL. Total cellular protein was collected 0, 4, 12, and 24 hours after treatment with 0.1 U/ml LE. The panels illustrate PUMA, Noxa, Bax, and Bcl-xL, respectively, and the last panel illustrates α-actin as a control. Representative data each from 1 of 5 experiments are shown. (B) Immunoprecipitation (IP) analysis of the PUMA–Bcl-xL and p53–Bcl-xL complexes. Cytoplasmic proteins were collected after 0, 4, 12, and 24 hours of treatment with LE (0.1 U/ml). After IP, proteins in the immune complexes were solubilized and analyzed by SDS-PAGE and Western analysis. The first panel illustrates p53, and the second panel PUMA co-immunoprecipitation with Bcl-xL. The last panel represents Bcl-xL as a control for loading. Representative data each from n = 3 experiments are shown. The graph shows densitometry units normalized to the level of Bcl-xL. Values are mean ± SD.
Figure 7.
Figure 7.
(A) LE induces alterations in the subcellular distribution of p53. Nuclear, mitochondrial, and cytosolic cell fractions were collected at 0, 4, 12, and 24 hours after treatment of cells with 0.1 U/ml of LE. The upper panels illustrate levels of nuclear p53, mitochondrial p53, and cytosolic p53. Histone H2B, COX IV, and GAPDH are used as markers for each of these fractions. Representative data each from 1 of 3 experiments are shown. The graphs depict densitometric analysis normalized to the level of the protein markers of each fraction. Values are mean ± SD. *P < 0.05; **P < 0.01. (B) LE induces Bax translocation from cytosol to mitochondria, and release of mitochondrial cytochrome c to the cytosol. Cells fractions were collected after 0, 4, 12, and 24 hours of incubation with 0.1 U/ml of leukocyte elastase. COX IV is used as a marker for the mitochondrial fraction and GAPDH as a marker for the cytosolic fraction. Representative data from 1 of 5 experiments are shown.
Figure 8.
Figure 8.
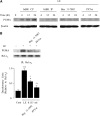
The role of NF-κB in elastase-induced PUMA expression. (A) Inhibition of NF-κB or p53 reduces PUMA expression. Cells were pretreated with 50 μg/ml of IκBK CP, IκBK IP, 5 μM of Bay11-7082, and 50 μM of PFT-α, respectively. Total cellular proteins were collected 0, 4, 12, and 24 hours after treatment with LE. The upper panels illustrate PUMA expression by Western analysis. α-actin was used a control for protein loading. Representative data from 1 of 3 experiments are shown. (B) Inhibition of NF-κB and p53 reduces the PUMA–Bcl-xL complex. Cells were pretreated with Bay11-7082 or PFT-α. Cytoplasmic proteins were collected 24 hours after treatment with LE. After immunoprecipitation of Bcl-xL, the immune complexes were solubilized and analyzed by SDS-PAGE, followed by Western blotting. The upper panel represents co-immunoprecipitation of PUMA and Bcl-xL. The lower panel illustrates Bcl-xL levels as a control. Representative data each from 1 of 3 experiments are shown. The graph depicts densitometry units normalized to the level of Bcl-xL. Values are mean ± SD. (C) siRNA knockdown of PUMA substantially reduces the levels PUMA protein as assessed by Western analysis. (D) siRNA knockdown of PUMA substantially reduces elastase-induced of lung epithelial cell apoptosis with maximum inhibition observed with 50 nM siRNA.
Figure 8.
Figure 8.
The role of NF-κB in elastase-induced PUMA expression. (A) Inhibition of NF-κB or p53 reduces PUMA expression. Cells were pretreated with 50 μg/ml of IκBK CP, IκBK IP, 5 μM of Bay11-7082, and 50 μM of PFT-α, respectively. Total cellular proteins were collected 0, 4, 12, and 24 hours after treatment with LE. The upper panels illustrate PUMA expression by Western analysis. α-actin was used a control for protein loading. Representative data from 1 of 3 experiments are shown. (B) Inhibition of NF-κB and p53 reduces the PUMA–Bcl-xL complex. Cells were pretreated with Bay11-7082 or PFT-α. Cytoplasmic proteins were collected 24 hours after treatment with LE. After immunoprecipitation of Bcl-xL, the immune complexes were solubilized and analyzed by SDS-PAGE, followed by Western blotting. The upper panel represents co-immunoprecipitation of PUMA and Bcl-xL. The lower panel illustrates Bcl-xL levels as a control. Representative data each from 1 of 3 experiments are shown. The graph depicts densitometry units normalized to the level of Bcl-xL. Values are mean ± SD. (C) siRNA knockdown of PUMA substantially reduces the levels PUMA protein as assessed by Western analysis. (D) siRNA knockdown of PUMA substantially reduces elastase-induced of lung epithelial cell apoptosis with maximum inhibition observed with 50 nM siRNA.
Figure 9.
Figure 9.
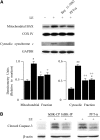
(A) Inhibition of p53 and NF-κB reduces mitochondrial Bax and cytosolic cytochrome c. Cells were pretreated with 5 μM of Bay11-7082 or 50 μM of PFT-α. After pretreatment, cells were incubated with LE for 24 hours followed by cellular fractionation. The first panel represents mitochondrial Bax protein expression and the second panel shows COX IV used here as a marker for the mitochondrial fraction. The third panel shows cytosolic cytochrome c levels, and the fourth panel illustrates GAPDH as a marker for the cytosolic fraction. Representative data from 1 of 4 experiments are shown. The graphs depict densitometry units normalized to the levels of each fraction marker. Values are mean ± SD. (B) The upper panel illustrates cleaved caspase-3 levels, and the lower panel shows α-actin levels by Western analysis. BEAS-2B cells were pretreated with IκB kinase inactive control peptide or IκB kinase inhibitory peptide for 1 hour, or with 50 μM of PFT-α for 2 hours. Representative data from 1 of 4 experiments are shown. (C) BEAS-2B cells were pretreated as described above and exposed to LE for an additional 18 hours. The upper panels represent anti–cleaved caspase-3–labeled epithelium (green fluorescence). The lower panels represent transmitted light images. Representative data from 1 of 3 experiments are shown.
Figure 9.
Figure 9.
(A) Inhibition of p53 and NF-κB reduces mitochondrial Bax and cytosolic cytochrome c. Cells were pretreated with 5 μM of Bay11-7082 or 50 μM of PFT-α. After pretreatment, cells were incubated with LE for 24 hours followed by cellular fractionation. The first panel represents mitochondrial Bax protein expression and the second panel shows COX IV used here as a marker for the mitochondrial fraction. The third panel shows cytosolic cytochrome c levels, and the fourth panel illustrates GAPDH as a marker for the cytosolic fraction. Representative data from 1 of 4 experiments are shown. The graphs depict densitometry units normalized to the levels of each fraction marker. Values are mean ± SD. (B) The upper panel illustrates cleaved caspase-3 levels, and the lower panel shows α-actin levels by Western analysis. BEAS-2B cells were pretreated with IκB kinase inactive control peptide or IκB kinase inhibitory peptide for 1 hour, or with 50 μM of PFT-α for 2 hours. Representative data from 1 of 4 experiments are shown. (C) BEAS-2B cells were pretreated as described above and exposed to LE for an additional 18 hours. The upper panels represent anti–cleaved caspase-3–labeled epithelium (green fluorescence). The lower panels represent transmitted light images. Representative data from 1 of 3 experiments are shown.
Figure 10.
Figure 10.
Model of the proposed pathways involved in apoptosis of lung epithelial cells induced by LE. PAR-1 is triggered in response to LE treatment, leading to activation of NF-κB and p53 and enhanced expression PUMA (transcriptional effect). Increased levels of PUMA protein displace p53 from Bcl-XL, liberating free cytosolic p53 that in turn activates Bax that translocates to the mitochondria activating the intrinsic apoptotic pathway (post-translational effect).

Similar articles

Cited by

References

    1. Savill J. Apoptosis and renal injury. Curr Opin Nephrol Hypertens 1995;4:263–269. - PubMed
    1. Sabbah HN, Sharov VG. Apoptosis in heart failure. Prog Cardiovasc Dis 1998;40:549–562. - PubMed
    1. Ginzberg HH, Shannon PT, Suzuki T, Hong O, Vachon E, Moraes T, Abreu MT, Cherepanov V, Wang X, Chow CW, et al. Leukocyte elastase induces epithelial apoptosis: role of mitochondial permeability changes and Akt. Am J Physiol Gastrointest Liver Physiol 2004;287:G286–G298. - PubMed
    1. Chin AC, Parkos CA. Pathobiology of neutrophil transepithelial migration: implications in mediating epithelial injury. Annu Rev Pathol 2007;2:111–143. - PubMed
    1. Kawabata K, Hagio T, Matsuoka S. The role of neutrophil elastase in acute lung injury. Eur J Pharmacol 2002;451:1–10. - PubMed

Publication types

MeSH terms