. 2009 May 28;113(22):5536-48.
doi: 10.1182/blood-2008-12-193037. Epub 2009 Mar 23.

The BCL6 transcriptional program features repression of multiple oncogenes in primary B cells and is deregulated in DLBCL

Affiliations

The BCL6 transcriptional program features repression of multiple oncogenes in primary B cells and is deregulated in DLBCL

Weimin Ci et al. Blood. .

Abstract

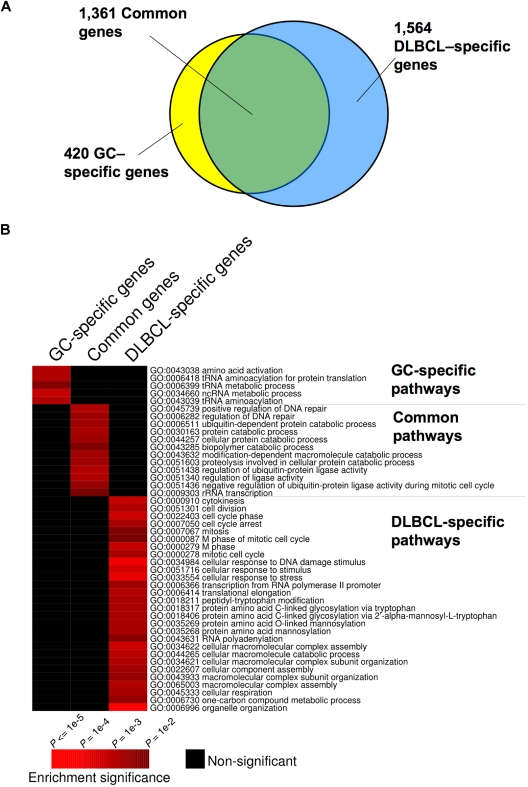
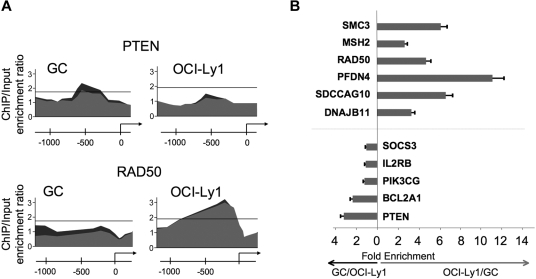
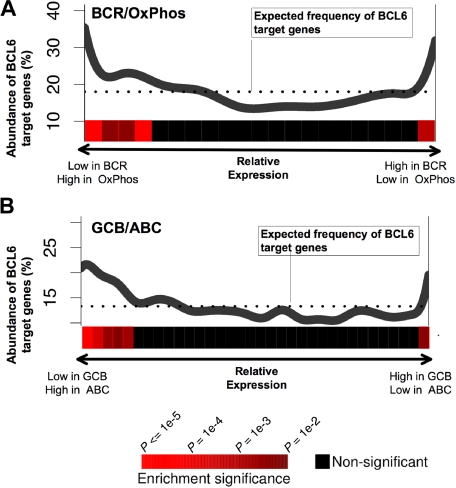
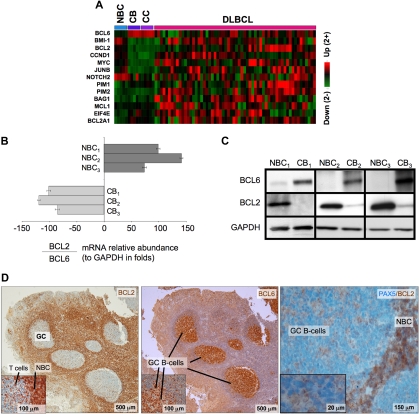
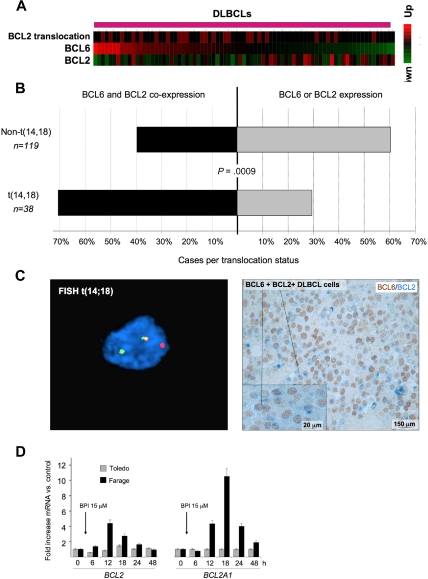
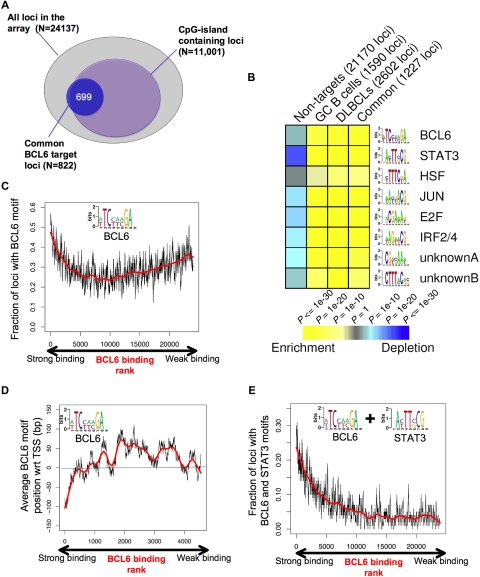
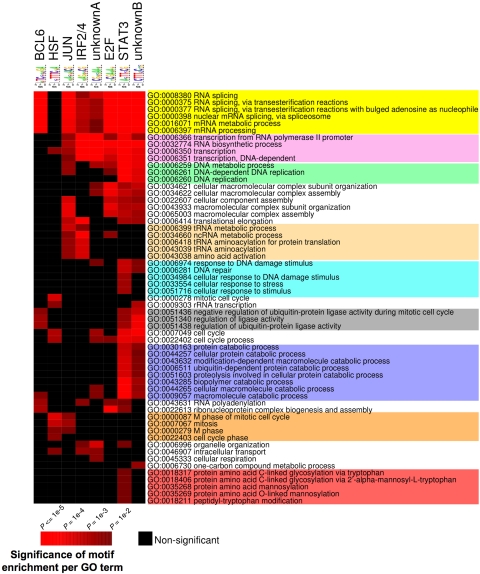
The BCL6 transcriptional repressor is required for development of germinal center (GC) B cells and when expressed constitutively causes diffuse large B-cell lymphomas (DLBCLs). We examined genome-wide BCL6 promoter binding in GC B cells versus DLBCLs to better understand its function in these settings. BCL6 bound to both distinct and common sets of functionally related gene in normal GC cells versus DLBCL cells. Certain BCL6 target genes were preferentially repressed in GC B cells, but not DLBCL cells. Several such genes have prominent oncogenic functions, such as BCL2, MYC, BMI1, EIF4E, JUNB, and CCND1. BCL6 and BCL2 expression was negatively correlated in primary DLBCLs except in the presence of BCL2 translocations. The specific BCL6 inhibitor retro-inverso BCL6 peptidomimetic inhibitor-induced expression of BCL2 and other oncogenes, consistent with direct repression effects by BCL6. These data are consistent with a model whereby BCL6 can directly silence oncogenes in GC B cells and counterbalance its own tumorigenic potential. Finally, a BCL6 consensus sequence and binding sites for other physiologically relevant transcription factors were highly enriched among target genes and distributed in a pathway-dependent manner, suggesting that BCL6 forms specific regulatory circuits with other B-cell transcriptional factors.


Figures

Figure 1
Figure 1
Distinct and overlapping BCL6 target genes in DLBCL and GC B cells. (A) The Venn diagram illustrates the numbers of target genes specific to GC B cells, DLBCL cells, and the number of the common target genes between these cell types. (B) The heatmap represents the combination of GO term enrichment identified by PAGE in GC-specific, DLBCL-specific, and common target genes. Red indicates the intensity of enrichment of GO terms (rows) among these groups of target genes (columns). The statistical significance of the heatmap color code is provided.
Figure 2
Figure 2
Differential BCL6 binding to specific promoters in DLBCL and GC B cells. (A) An example of BCL6-binding peaks for genes that were identified as differentially bound in GC versus DLBCL cells. The y-axis indicates enrichment versus input. The x-axis indicates the location of probes within the respective loci relative to the transcriptional start site. The dark gray and light gray tracings correspond to the different replicates. (B) A subset of genes predicted to be differentially bound by ChIP-on-chip were validated by independent quantitative ChIP experiments. The x-axis measures the fold enrichment ratio of promoters in GC cells versus OCI-Ly1 (black arrow) or OCI-Ly1 versus GC cells (red arrow). The data are from 3 independent experiments. Error bars represent the SEM for triplicates.
Figure 3
Figure 3
BCL6 target genes are preferentially repressed in BCR and GCB-type DLBCLs. The figure shows a graphical representation depicting the abundance of BCL6 targets among genes that are either repressed or up-regulated in (A) BCR versus OxPhos and (B) GCB versus ABC DLBCLs. Each panel contains a plot in which the x-axis represents all of the genes contained in our promoter arrays distributed according to whether they are repressed preferentially in BCR (A left) or OxPhos (A right), or in GCB (B left) or ABC (B right). The y-axis represents the percentage of these genes that were found to be BCL6 targets by ChIP-on-chip. The dotted line represents the percentage of genes that would be expected to be BCL6 targets if the BCL6 targets were uniformly distributed across the range of relative expression values. The statistical significance of the enrichment for BCL6 target genes is indicated by the heatmap that is below each of the plots, as shown in the heatmap color code at the bottom of the figure.
Figure 4
Figure 4
BCL6 represses many oncogenes in centroblasts. (A) A heatmap is shown representing the transcript abundance (data from Basso) of oncogenes and related genes that are direct transcriptional targets of BCL6 (NBC indicates naive B cells; CB, centroblasts; and CC, centrocytes). (B) The relative ratio of BCL2 to BCL6 mRNA abundance versus GAPDH was measured in 3 independent sets of human tonsilar NBC and CBs by quantitative PCR (error bars represent the SEM for triplicates), and (C) Western blots. (D) Human tonsil sections were submitted to immunohistochemistry with BCL2 and nuclear counterstain (right panel and inset), BCL6 antibody and counterstain (middle), and with PAX5 and BCL2 costaining. The data show inverse staining patterns of BCL6 and BCL2 in GCs and show that the PAX5-positive GC B cells lack BCL2, indicating the BCL2-positive GC cells are not of the B-cell lineage. Slides were viewed with a light microscope (AxioSkop2; Carl Zeiss Microimaging, Thornwood, NY) using Plan-Neofluar lens at a 10×/0.50 air objective, 40×/0.90 oil objective, 100×/1.30 oil objective. Images were taken using a color camera (AxioCam; Carl Zeiss Microimaging) and were processed using Axiovision software (Carl Zeiss Microimaging).
Figure 5
Figure 5
BCL6 and BCL2 inverse correlation is disrupted in patients with BCL2 translocations. (A) A series of DLBCLs (columns) is plotted in a heatmap and distributed according to their abundance of BCL6 transcript (data from Lenz et al). BCL2 mRNA is generally negatively correlated with BCL6. Cases with BCL2 translocations are indicated by the red boxes in the top row. (B) Expression of BCL2 and BCL6 was examined in a series of 157 DLBCL patients by immunohistochemistry. The top bar represents patients without BCL2 translocation; bottom bar, BCL2 translocated cases. In each case, the black bar represents the percentage of patients who express both BCL6 and BCL2, whereas the gray bar represents the percentage of tumors that express either BCL2 or BCL6 exclusively. (C) Immunohistochemistry shows that DLBCL cases with t(14;18) translocations (left panel) typically exhibit malignant cells with dual BCL2 (blue) and BCL6 (brown) protein expression (right panel). FISH results were visualized using a Zeiss LSM510 Multiphoton confocal microscope (Carl Zeiss Microimaging) equipped with 40×/0.75/0.72 and 60×/0.80/0.3 objectives and one 25-mW argon laser exciting at 458, 488, and 514 nm and one 1-mW helium-neon laser exciting at 543 nm; proprietary image acquisition software was used for image analysis. (D) The DLBCL cell lines Farage (which expresses BCL6 and has wild-type BCL2 locus) and Toledo (which is BCL6-negative) were exposed for the indicated times to the specific BCL6 peptidomimetic inhibitor RI-BPI. The y-axis represents the fold increase of mRNA change induced by RI-BPI versus a control peptide. Cells were treated as indicated, and the data were from 3 independent experiments. Error bars represent the SEM for triplicates.
Figure 6
Figure 6
BCL6 target genes display specific genomic features and DNA elements. (A) The diagram depicts the overlap between the overlapping BCL6 genes between normal and malignant B cells (blue circle) and CpG island-containing loci among the entire pool of 24 137 promoters contained on the array. (B) Analysis of the BCL6 target gene cohort by FIRE identified 8 DNA elements significantly overrepresented among BCL6 target genes identified in GC cells (CB), DLBCL cells, the common target genes, or in the cohort of non-BCL6 targets (columns). Yellow represents highly enriched; and blue, relative depletion. The statistical significance of the heatmap color code is provided. (C) The graph represents the distribution of genes ordered according to the strength of BCL6 binding in ChIP-on-chip on the x-axis and the frequency with which genes contain the BCL6 consensus site identified by FIRE (inset), using a sliding window of 100 genes. (D) Genes are distributed along the x-axis according to BCL6 binding, and the y-axis depicts the position of the FIRE-identified BCL6 motif occurrences relative to the transcriptional start site (set at 0). Negative numbers are upstream and positive numbers downstream of the start site. Similar to panel C, the y-axis corresponds to the average position of BCL6 motif occurrences with respect to the transcription start site using a sliding window of 100 genes. Only genes containing at least one occurrence of the BCL6 motif were considered. (E) Similar to panel C, the graph represents BCL6 binding on the x-axis, but the y-axis shows the frequency at which genes contain both BCL6 and STAT3-binding elements.
Figure 7
Figure 7
Consensus motif identification by FIRE distribute to different GO terms. PAGE was performed to identify GO terms (rows) associated with BCL6 target genes according to the presence of the several DNA elements identified by FIRE (columns). Brighter red color is indicative of enrichment of the respective motifs for the indicated GO terms. The differently colored shading of the GO terms is provided to highlight those that are preferentially associated with different subsets of binding motifs. The statistical significance of the heatmap color code is provided.

References

    1. Klein U, Dalla-Favera R. Germinal centres: role in B-cell physiology and malignancy. Nat Rev Immunol. 2008;8:22–33. - PubMed
    1. Ye BH, Cattoretti G, Shen Q, et al. The BCL-6 proto-oncogene controls germinal-centre formation and Th2-type inflammation. Nat Genet. 1997;16:161–170. - PubMed
    1. Dent AL, Shaffer AL, Yu X, Allman D, Staudt LM. Control of inflammation, cytokine expression, and germinal center formation by BCL-6. Science. 1997;276:589–592. - PubMed
    1. Ranuncolo SM, Polo JM, Dierov J, et al. Bcl-6 mediates the germinal center B cell phenotype and lymphomagenesis through transcriptional repression of the DNA-damage sensor ATR. Nat Immunol. 2007;8:705–714. - PubMed
    1. Cerchietti LC, Polo JM, Da Silva GF, et al. Sequential transcription factor targeting for diffuse large B-cell lymphomas. Cancer Res. 2008;68:3361–3369. - PMC - PubMed

Publication types

MeSH terms

Substances