. 2009 Apr;119(4):964-75.
doi: 10.1172/JCI37630. Epub 2009 Mar 23.

The genotoxic potential of retroviral vectors is strongly modulated by vector design and integration site selection in a mouse model of HSC gene therapy

Affiliations

The genotoxic potential of retroviral vectors is strongly modulated by vector design and integration site selection in a mouse model of HSC gene therapy

Eugenio Montini et al. J Clin Invest. 2009 Apr.

Abstract

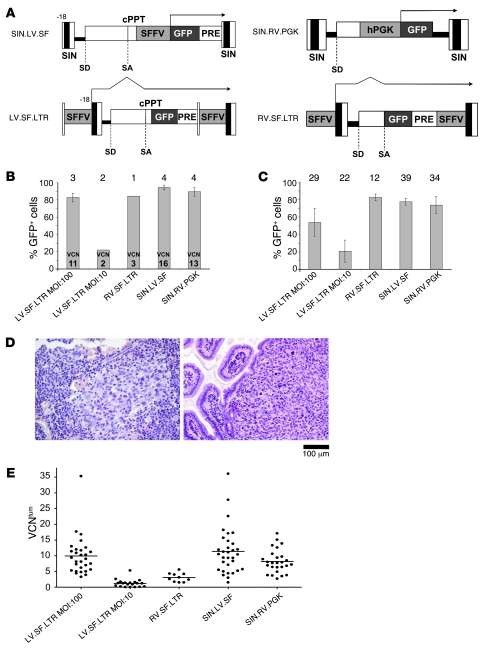
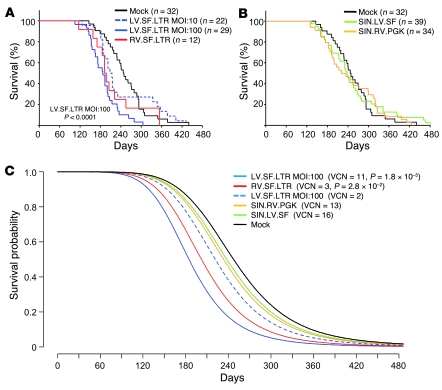
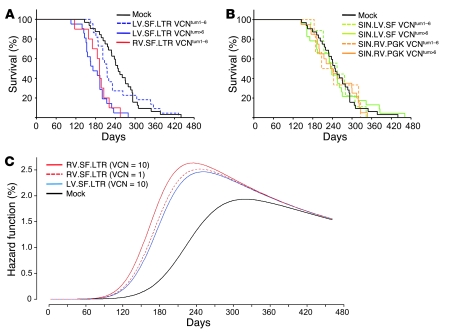
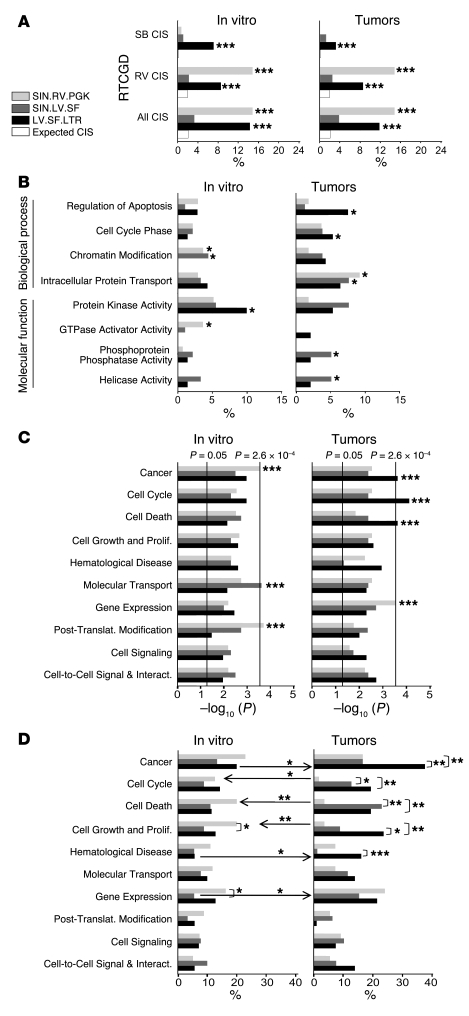
gamma-Retroviral vectors (gammaRVs), which are commonly used in gene therapy, can trigger oncogenesis by insertional mutagenesis. Here, we have dissected the contribution of vector design and viral integration site selection (ISS) to oncogenesis using an in vivo genotoxicity assay based on transplantation of vector-transduced tumor-prone mouse hematopoietic stem/progenitor cells. By swapping genetic elements between gammaRV and lentiviral vectors (LVs), we have demonstrated that transcriptionally active long terminal repeats (LTRs) are major determinants of genotoxicity even when reconstituted in LVs and that self-inactivating (SIN) LTRs enhance the safety of gammaRVs. By comparing the genotoxicity of vectors with matched active LTRs, we were able to determine that substantially greater LV integration loads are required to approach the same oncogenic risk as gammaRVs. This difference in facilitating oncogenesis is likely to be explained by the observed preferential targeting of cancer genes by gammaRVs. This integration-site bias was intrinsic to gammaRVs, as it was also observed for SIN gammaRVs that lacked genotoxicity in our model. Our findings strongly support the use of SIN viral vector platforms and show that ISS can substantially modulate genotoxicity.


Figures

Figure 1
Figure 1. Transduction of Cdkn2a–/– HSPC by chimeric vectors and tumor development in transplanted mice.
(A) Scheme of the proviral forms of the vectors tested. SIN, SIN LTR with deletion of the U3 region; SFFV, enhancer/promoter of the SF U3 LTR; PGK, promoter of the human phosphoglycerate kinase gene; SD and SA, viral splice donor/acceptor sites; cPPT, central polypurine tract; PRE, posttranscriptional regulatory element from the woodchuck hepatitis virus. Transgene transcripts are indicated by arrows. (B) Percentage of GFP+ (mean ± SD) linCdkn2a–/– cells transduced in vitro with the indicated vectors 6 days after transduction. Number of experiments indicated on top. The average VCN per cell measured by Q-PCR 14 days after transduction is indicated inside the bar. (C) Percentage of GFP+ cells (mean ± SD) in the blood of transplanted mice at 6–8 weeks after transplant. Number of mice indicated on top. (D) Representative H&E-stained sections of BM (left panel) and gut (right panel) from a myeloid tumor in the RV.SF.LTR group. Original magnification, ×20. Scale bar: 100 μm. (E) VCN distribution in tumor-infiltrated (VCNtum) tissue (BM, spleen or thymus) for each mouse analyzed (dots) among the different treatment groups. Horizontal line represents the average VCN for each group.
Figure 2
Figure 2. Survival curves related to vector treatment.
(A and B) Kaplan-Meier survival curves of mice transplanted with cells transduced with SF.LTR vectors (A) and SIN.LTR vectors (B). For each panel, the survival curve of the mock group is shown (n = number of transplanted mice). Survival of the LV.SF.LTR, MOI = 100, group was significantly shorter than that of the mock group (P < 0.0001; Mantel-Cox log-rank test). (C) Survival probability over time was calculated for each group using the estimated log-logistic parameter (shown in Table 2) and compared with that of the mock group. The survival probability of the LV.SF.LTR, MOI = 100, and the RV.SF.LTR groups was significantly lower than that of the mock group (P values are indicated). A sample of the transduced cells was kept in vitro for 2 weeks after transduction to measure the average VCN (shown for reference).
Figure 3
Figure 3. Survival curves and risk assessment related to vector treatment and dose.
(A and B) Kaplan-Meier survival curves of mice treated with the SF.LTR (A) and SIN LTR vectors (B) stratified by the VCNtum. (C) Percentage hazard of death over time of mice depending on the vector used and a fixed VCNtum of 1 (solid lines) or 10 (dashed lines).
Figure 4
Figure 4. Vector integration site analysis in cells before transplant and in tumors.
(A) Percentage of retroviral, SB transposon, and total (all) RTCGD CIS genes targeted in vitro and in tumors by each vector, as indicated. The expected random frequency was calculated as fraction of all mouse genes (25,613 genes). Significant overrepresentation versus the expected frequency (P < 0.05; χ2 test) is indicated by asterisks. *P < 0.05; **P < 0.01; ***P < 0.001. (B) Percentage of vector integrations (as in A) targeting the indicated GO classes in vitro and in tumors. Significantly overrepresented classes are indicated by asterisks. Fisher’s exact test. (C) Significance of overrepresented functional pathways of the IPA software is shown as –log10 P value. The significance threshold of P < 0.05 is indicated. Multiple comparison error correction by Bonferroni’s method decreases the significance level to P < 0.00026 (63 gene classes for 3 vectors = 189 gene comparisons, α level of 0.05). Prolif., Proliferation; Post-Translat., Post-Translational; Interact., Interaction. (D) Percentages of genes belonging to the indicated IPA functional pathways were compared for each data set. Statistically significant differences (P < 0.05, Fisher’s exact test) between the vectors in the same condition (bracket) or between the in vitro and tumor data set for the same vector (arrow) are indicated. Arrows from left to right indicate a significant enrichment from in vitro to tumors of the given gene class.
Figure 5
Figure 5. Gene expression analysis at LV.SF.LTR integration sites in tumors.
(AC) Expression of the indicated genes was measured by Q–RT-PCR on tumor-infiltrated BM or spleen cDNA (see also Supplemental Table 6). Expression data for primary and serially transplanted tumors with an integrated vector near the tested gene (INT) and phenotype-matched tumors with integrated vector in different sites or without integrations (No INT) are plotted. Each point is the fold change relative to matched-type tumor-infiltrated BM or spleen from the mock group (control level = 1); the horizontal bar represents the average. P value of the Mann-Whitney test comparison between the samples is indicated. P < 0.05 is considered significant. Genomic region targeted by the vector (vector position and orientation are represented by arrows) is shown below each set of expression data. Genes above the thick horizontal bar (chromosome) are transcribed from left to right; those below the chromosome are transcribed in the opposite direction. (A) Tgtp, which encodes for an interferon-inducible T cell–specific GTPase and whose TSS maps 530 bp from the vector integration, was overexpressed in both tumor-infiltrated BM and spleen of 2 primary and 4 secondary transplanted mice bearing the same integration; the expression of other genes surrounding the integration was not altered (see details in Supplemental Table 6). (B) Another integration from the same groups of mice mapped within the Sos1 (37) oncogene, leading to its significant overexpression. (C) Vector integration occurred within the Eps15 (38) oncogene, leading to its overexpression in tumors of 1 primary and 2 secondary transplanted mice.
Figure 6
Figure 6. Oncogenic LV/Braf chimeric transcripts in an LV.SF.LTR tumor.
(A) Genomic position of an LV.SF.LTR integration in a myeloid tumor targeting intron 11 of Braf. Chromosome (Chr) number and coordinates are indicated on top. The genomic interval covering exons 11 to 14 (gray boxes) is depicted. The position of the LV.SF.LTR integration (black box; LTR direction is indicated by the gray arrow) clusters with 20 SB integrations from sarcomas (39) in a narrow 4-kb region within introns 11 and 12. (B) RT-PCR using primers complementary to LV LTR and exon 22 of Braf on cDNA from the tumor described in A amplified a 1500-bp product. RT+, tumor cDNA; RT–, tumor RNA processed without reverse transcriptase; M molecular size markers. (C) The sequence of the RT-PCR product in B aligns to LV and to Braf exons. Black bars, amplified cDNA sequence; dashed lines, splicing events; F and R arrows, primers used for cDNA amplification; 3′UTR, 3′ untranslated region of Braf; SD, LV 5′ splice donor site. The cDNA sequence was LV specific up to the splice donor site (HIV) fused to the correct splice junction of exon 13 of Braf (boxed); exon 12 appears to be skipped. The first putative starting ATG codon in exon 13 is in the correct frame to produce a truncated Braf protein (indicated).

Comment in

Similar articles

Cited by

References

    1. von Kalle C., et al. Stem cell clonality and genotoxicity in hematopoietic cells: gene activation side effects should be avoidable. Semin. Hematol. 2004;41:303–318. doi: 10.1053/j.seminhematol.2004.07.007. - DOI - PubMed
    1. Baum C., et al. Side effects of retroviral gene transfer into hematopoietic stem cells. Blood. 2003;101:2099–2114. doi: 10.1182/blood-2002-07-2314. - DOI - PubMed
    1. Hacein-Bey-Abina S., et al. A serious adverse event after successful gene therapy for X-linked severe combined immunodeficiency. N. Engl. J. Med. 2003;348:255–256. doi: 10.1056/NEJM200301163480314. - DOI - PubMed
    1. Ott M.G., et al. Correction of X-linked chronic granulomatous disease by gene therapy, augmented by insertional activation of MDS1-EVI1, PRDM16 or SETBP1. Nat. Med. 2006;12:401–409. doi: 10.1038/nm1393. - DOI - PubMed
    1. Will E., et al. Importance of murine study design for testing toxicity of retroviral vectors in support of phase I trials. Mol. Ther. 2007;15:782–791. - PubMed

Publication types

MeSH terms

Substances