. 2009;4(3):e4998.
doi: 10.1371/journal.pone.0004998. Epub 2009 Mar 24.

MicroRNA-199b-5p impairs cancer stem cells through negative regulation of HES1 in medulloblastoma

Affiliations

MicroRNA-199b-5p impairs cancer stem cells through negative regulation of HES1 in medulloblastoma

Livia Garzia et al. PLoS One. 2009.

Abstract

Background: Through negative regulation of gene expression, microRNAs (miRNAs) can function in cancers as oncosuppressors, and they can show altered expression in various tumor types. Here we have investigated medulloblastoma tumors (MBs), which arise from an early impairment of developmental processes in the cerebellum, where Notch signaling is involved in many cell-fate-determining stages. MBs occur bimodally, with the peak incidence seen between 3-4 years and 8-9 years of age, although it can also occur in adults. Notch regulates a subset of the MB cells that have stem-cell-like properties and can promote tumor growth. On the basis of this evidence, we hypothesized that miRNAs targeting the Notch pathway can regulated these phenomena, and can be used in anti-cancer therapies.

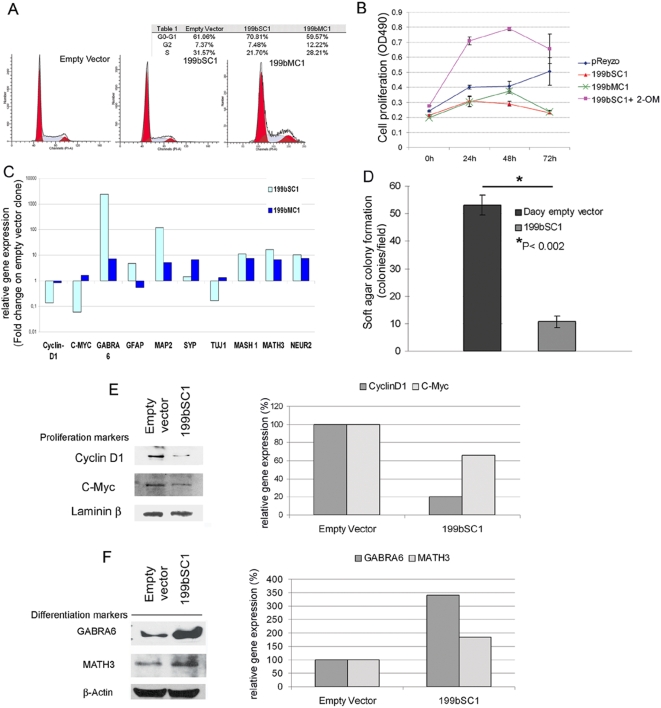
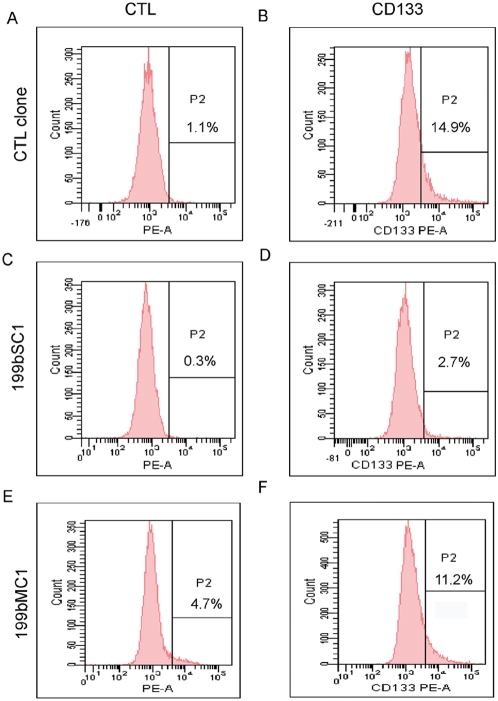
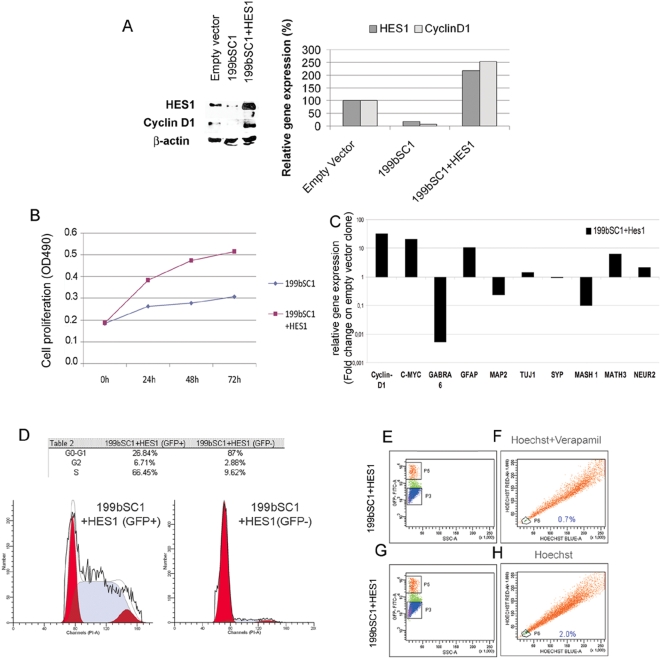
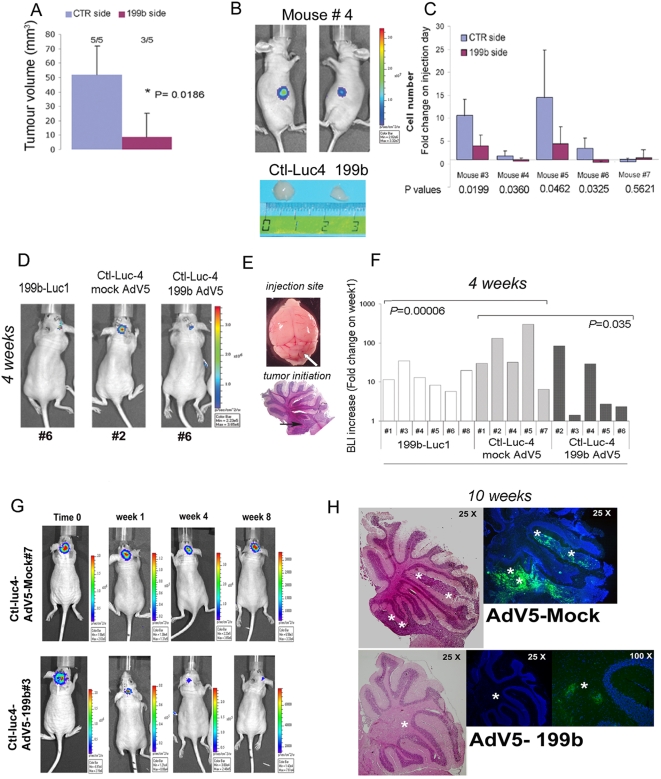
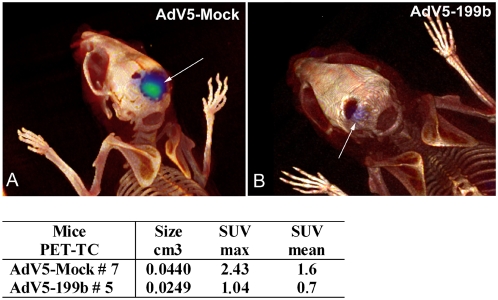
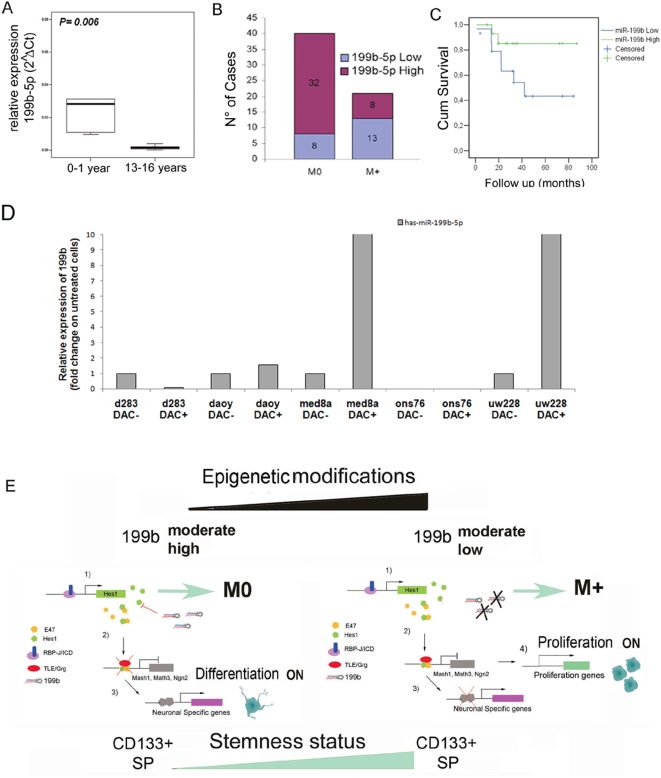
Methodology/principal findings: In a screening of MB cell lines, the miRNA miR-199b-5p was seen to be a regulator of the Notch pathway through its targeting of the transcription factor HES1. Down-regulation of HES1 expression by miR-199b-5p negatively regulates the proliferation rate and anchorage-independent growth of MB cells. MiR-199b-5p over-expression blocks expression of several cancer stem-cell genes, impairs the engrafting potential of MB cells in the cerebellum of athymic/nude mice, and of particular interest, decreases the MB stem-cell-like (CD133+) subpopulation of cells. In our analysis of 61 patients with MB, the expression of miR-199b-5p in the non-metastatic cases was significantly higher than in the metastatic cases (P = 0.001). Correlation with survival for these patients with high levels of miR-199b expression showed a positive trend to better overall survival than for the low-expressing patients. These data showing the down-regulation of miR-199b-5p in metastatic MBs suggest a potential silencing mechanism through epigenetic or genetic alterations. Upon induction of de-methylation using 5-aza-deoxycytidine, lower miR-199b-5p expression was seen in a panel of MB cell lines, supported an epigenetic mechanism of regulation. Furthermore, two cell lines (Med8a and UW228) showed significant up-regulation of miR-199b-5p upon treatment. Infection with MB cells in an induced xenograft model in the mouse cerebellum and the use of an adenovirus carrying miR-199b-5p indicate a clinical benefit through this negative influence of miR-199b-5p on tumor growth and on the subset of MB stem-cell-like cells, providing further proof of concept.

Conclusions/significance: Despite advances in our understanding of the pathogenesis of MB, one-third of these patients remain incurable and current treatments can significantly damage long-term survivors. Here we show that miR-199b-5p expression correlates with metastasis spread, identifying a new molecular marker for a poor-risk class in patients with MB. We further show that in a xenograft model, MB tumor burden can be reduced, indicating the use of miR199b-5p as an adjuvant therapy after surgery, in combination with radiation and chemotherapy, for the improvement of anti-cancer MB therapies and patient quality of life. To date, this is the first report that expression of a miRNA can deplete the tumor stem cells, indicating an interesting therapeutic approach for the targeting of these cells in brain tumors.


Conflict of interest statement

Competing Interests: The authors have declared that no competing interests exist.

Figures

Figure 1
Figure 1. In-vitro function of miR199b-5b on proliferation and differentiation of Daoy MB cells.
A) Representative FACS analysis with propidium iodine showing a decrease in the percentages of cells in S phase and an increase in G0-G1 for the stable 199bSC1 clone. The absence of shoulder signals with the G0-G1 red peak in the 199bSC1 and 199bMC1 clones excludes apoptotic processes. B) Proliferation assays by 3-4,5-dimethylthiazol-2-yl-5-3-carboxymethoxyphenyl-2-4-sulfophenyl-2H-tetrazolium salt (MTS), showing decreased proliferation rates of the stable 199bSC1 clone (red triangles) and the 199bMC1 clone (green crosses), compared to the stable clone with empty vector alone (blue diamond). This effect of miR-199b-5p over-expression was reduced by 2-OM transfection (pink squares). The data shown are means±SD from two independent experiments, each carried out in triplicate. C) Rapresentative mRNA expression of differentiation (e.g. MASH1, MATH3 and NEUROGENIN 2) and proliferation (e.g. c-MYC, CYCLIN D1) markers upon miR-199b-5p over-expression, as revealed by real-time PCR, comparing the stable 199bSC1 and 199bMC1 clones with empty vector clone. D) The stable 199bSC1 clone for miR-199b-5p shows impaired colony formation in soft agar assays. The plot shows colonies counted as means±SD from three independent experiments, each carried out in triplicate. E) Representative Western blot using anti-c-Myc and anti-cyclin D1 antibodies show these two proteins to be down-regulated in the stable 199bSC1 clone; see also the densitometric analysis in the right panel. F) As for E, showing GABRA6 and MATH3 proteins up-regulated after miR-199b expression, suggesting induction of differentiation. Anti-Laminin-β antibodies were used to normalized nuclear c-Myc and cyclin D1 protein expression. Anti-β-Actin antibodies were used to normalized cytoplasmic GABRA6 and MATH3 proteins expression.
Figure 2
Figure 2. Over-expression of miR-199b-5p decreases the CD133+ compartment of Daoy cells.
A–F) Representative FACS analyses of the stable 199bSC1 (D) and 199bMC1 (F) clones showed a decrease in the percentage of cells that were positive for the stem cell marker CD133 (B); A, C and E are negative controls (no antibody).
Figure 3
Figure 3. The effects of miR-199b-5p over-expression are reversed by HES1 transfection.
A) Representative Western blot and densitometric analysis showing that the rescue of HES1 expression by over-expression of HES1 cDNA in the stable 199bSC1 clone restores cyclin D1 expression. B) Proliferation assay by 3-4,5-dimethylthiazol-2-yl-5-3-carboxymethoxyphenyl-2-4-sulfophenyl-2H-tetrazolium salt (MTS) showing increased proliferation rate of the stable 199bSC1 clone with HES1 expression (dark blue squares), compared to the stable 199bSC1 clone alone (light blue diamonds). The data shown are means±SD from two independent experiments, each carried out in triplicate. C) Rapresentative mRNA expression of differentiation (e.g. MASH1, MATH3 and NEUROGENIN 2) and proliferation (e.g. c-MYC, CYCLIN D1) markers upon cell-rescue with HES1 in the stable 199bSC1 clone, comparing with wild-type cells, as revealed by real-time PCR. The expression of GABRA 6 and MAP2 are down-regulated in the rescue experiment. D) Representative FACS analysis of the HES1-expressing stable 199bSC1 clone shows an increase in the fraction of cells in S phase, and a decrease in G1, with respect to the stable 199bSC1 clone alone. E–H) The effect of miR-199b-5p expression on the SP of Daoy cells is reversed by HES1 re-expression. 199bSC1 stable clone was transfected with HES1 cDNA and a GFP-coding plasmid, then treated after 48 hours with Hoechst and verapamil (E–F) or Hoechst alone (G–H) and analyzed by FACS. The GFP-positive cells (P5 gate), panel E and G, were analysed for the presence of dye-excluding-cells (F–H, P6 gate). The untransfected GFP negative cells (P3 gate), were not analised.
Figure 4
Figure 4. Decreased tumorigenicity of Daoy cells over-expressing miR-199b-5p.
A) Xenograft experiment over nine weeks, following s.c. injection of five mice with control Daoy cells (CTR side) and Daoy cells over-expressing miR-199b-5p (199b side). With CTR cells, tumors were detectable macroscopically in 5/5 mice; with over-expressing cells, in 3/5 mice. Total tumor volume difference between the CTR and 199b injected sides after nine weeks of growth was statistically significant, as indicated (means±SD). B) Photon emission of mouse #4 after nine weeks of tumor growth. The 199b side (199bLuc-1) had a consistently lower photon emission than the control side (Ctl-Luc-4). The comparisons of the tumor dimensions are also shown. C) When photon emission (see B) was converted to cell number; one of five mice showed no significant differences (means±SD) (two tailed unpaired t test). D) Photon emission of 3 mice injected in the fourth ventricle with respectively: 199bLuc-1, Ctl-Luc-4 infected with mock AdV5, and Ctl-Luc-4 infected with a miR-199b-5p AdV5. E) Entire brain of animal and site of injection (white arrow). Hematoxylin/eosin staining of cerebellum; black arrow, site of initiation of tumorigenesis. F) BLI of injected mice as for D, after one month of tumor growth. The differences between the groups are statistically significant. G) BLI of two selected mice showing development of tumor burden with Ctl-luc4-AdV5-Mock#7, and reduction with Ctl-luc4-AdV5-199b#3 over time (0–8 weeks). H) Hematoxylin-eosin staining of cerebellum from AdV5-Mock#2 and AdV5-199b#3 animals at 10 weeks post orthotopic injection, showing tumors cells surrounding external granular layer and within the IV ventricle (white star). In blue, DAPY staining, together with GFP detection. Magnification as indicated.
Figure 5
Figure 5. High-resolution molecular imaging of xenografted MB cells injected into the cerebellum.
PET-CT fusion images of AdV5-Mock#7 (A) and AdV5-199b#5 (B) mice at 12 weeks from surgery and injection, with 3D volume rendering and simultaneous display of areas of FLT uptake (blue–green, white arrows). A wider bone defect in the occipito-parietal portion of the skull is apparent in the AdV5-Mock#7 mouse. Below: table of measurements (cm3) of tumor mass undertaken with PET-CT acquisition (as described in Text S1).
Figure 6
Figure 6. Expression levels of miR199b in human cerebellum and in tumors, and the correlation with prognosis.
A) Box-plot of expression levels of miR-199b-5p in healthy human cerebella in the two age ranges indicated. MiR-199b-5p showed higher expression in explants from younger controls (Mann-Whitney test, P = 0.006). B) MiR-199b-5p highly expressing cases are mostly M0 P = 0.001 (Pearson Chi-Square test). C) Kaplan-Meier survival estimates comparing patients with low versus high (relative to median) levels of miR-199b-5p expression (45 patients with available follow-up data). D) MiR-199b-5p expression by real-time PCR in a panel of five MB cell lines untreated or treated with 5-Aza-C (DAC−/+); the de-methylation induced miR-199b-5p transcription in two cell lines: Med8a and UW228. E) The interplay between miR-199b-5p and the Notch pathway. M0 and M+ patients show different expression levels of miR-199b-5p, which could be driven by an epigenetic mechanism. Left side: Under conditions of induced miR-199b-5p expression (1), the levels of HES1 decrease, relieving the inhibition on the neurogenic bHLHs (2). This in turn promotes a neurogenic programme and a decrease in proliferation, SP and CD133+ cells (3). Right side: Under conditions of low miR-199b-5p expression, the levels of HES1 are higher (1), repressing the pro-neural bHLH genes, with a consequent increase in proliferation, SP and an enlargement of the CD133+ compartment (4).

References

    1. Bartel DP. MicroRNAs: genomics, biogenesis, mechanism, and function. Cell. 2004;116:281–297. - PubMed
    1. Hammond SM. MicroRNAs as oncogenes. Curr Opin Genet Dev. 2006;16:4–9. - PubMed
    1. O'Donnell KA, Wentzel EA, Zeller KI, Dang CV, Mendell JT. c-Myc-regulated microRNAs modulate E2F1 expression. Nature. 2005;435:839–843. - PubMed
    1. Calin GA, Dumitru CD, Shimizu M, Bichi R, Zupo S, et al. Frequent deletions and down-regulation of micro- RNA genes miR15 and miR16 at 13q14 in chronic lymphocytic leukemia. Proc Natl Acad Sci U S A. 2002;99:15524–15529. - PMC - PubMed
    1. Ciafre SA, Galardi S, Mangiola A, Ferracin M, Liu CG, et al. Extensive modulation of a set of microRNAs in primary glioblastoma. Biochem Biophys Res Commun. 2005;334:1351–1358. - PubMed

Publication types