

Analysis of 7,8-dihydro-8-oxo-2'-deoxyguanosine in cellular DNA during oxidative stress
- PMID: 19309085
- PMCID: PMC2684441
- DOI: 10.1021/tx800343c
Analysis of 7,8-dihydro-8-oxo-2'-deoxyguanosine in cellular DNA during oxidative stress
Abstract
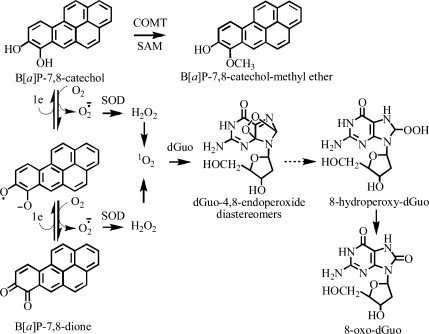
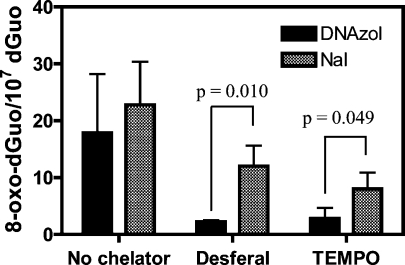
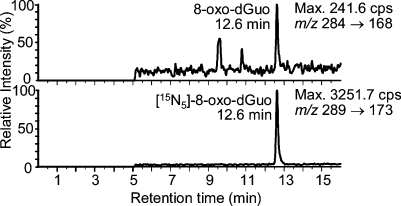
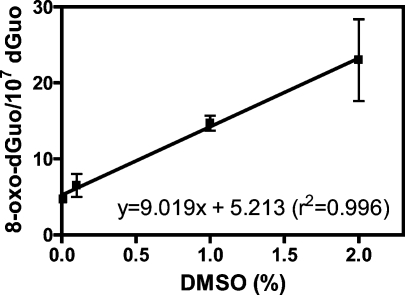
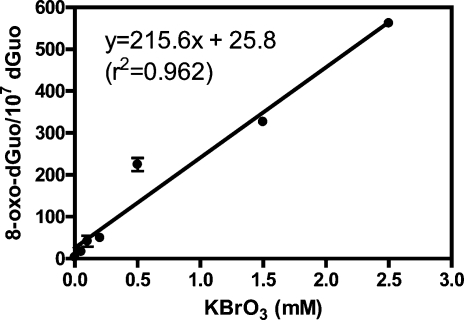
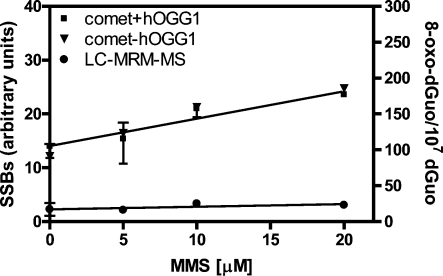
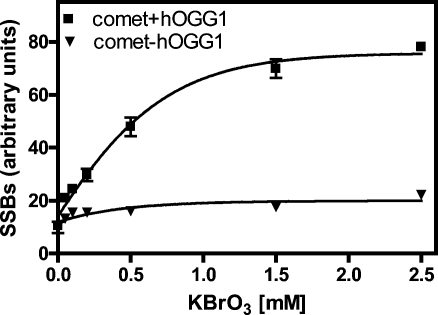
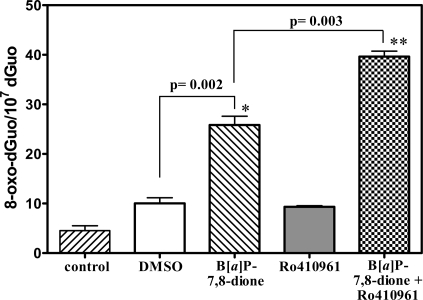
Analysis of cellular 7,8-dihydro-8-oxo-2'-deoxyguanosine (8-oxo-dGuo) as a biomarker of oxidative DNA damage has been fraught with numerous methodological problems. This is primarily due to artifactual oxidation of dGuo that occurs during DNA isolation and hydrolysis. Therefore, it has become necessary to rely on using the comet assay, which is not necessarily specific for 8-oxo-dGuo. A highly specific and sensitive method based on immunoaffinity purification and stable isotope dilution liquid chromatography (LC)-multiple reaction monitoring (MRM)/mass spectrometry (MS) that avoids artifact formation has now been developed. Cellular DNA was isolated using cold DNAzol (a proprietary product that contains guanidine thiocyanate) instead of chaotropic- or phenol-based methodology. Chelex-treated buffers were used to prevent Fenton chemistry-mediated generation of reactive oxygen species (ROS) and artifactual oxidation of DNA bases. Deferoxamine was also added to all buffers in order to complex any residual transition metal ions remaining after Chelex treatment. The LC-MRM/MS method was used to determine that the basal 8-oxo-dGuo level in DNA from human bronchoalveolar H358 cells was 2.2 +/- 0.4 8-oxo-dGuo/10(7) dGuo (mean +/- standard deviation) or 5.5 +/- 1.0 8-oxo-dGuo/10(8) nucleotides. Similar levels were observed in human lung adenocarcinoma A549 cells, mouse hepatoma Hepa-1c1c7 cells, and human HeLa cervical epithelial adenocarcinoma cells. These values are an order of magnitude lower than is typically reported for basal 8-oxo-dGuo levels in DNA as determined by other MS- or chromatography-based assays. H358 cells were treated with increasing concentrations of potassium bromate (KBrO3) as a positive control or with the methylating agent methyl methanesulfonate (MMS) as a negative control. A linear dose-response for 8-oxo-dGuo formation (r(2) = 0.962) was obtained with increasing concentrations of KBrO3 in the range of 0.05 mM to 2.50 mM. In contrast, no 8-oxo-dGuo was observed in H358 cell DNA after treatment with MMS. At low levels of oxidative DNA damage, there was an excellent correlation between a comet assay that measured DNA single strand breaks (SSBs) after treatment with human 8-oxo-guanine glycosylase-1 (hOGG1) when compared with 8-oxo-dGuo in the DNA as measured by the stable isotope dilution LC-MRM/MS method. Availability of the new LC-MRM/MS assay made it possible to show that the benzo[a]pyrene (B[a]P)-derived quinone, B[a]P-7,8-dione, could induce 8-oxo-dGuo formation in H358 cells. This most likely occurred through redox cycling between B[a]P-7,8-dione and B[a]P-7,8-catechol with concomitant generation of DNA damaging ROS. In keeping with this concept, inhibition of catechol-O-methyl transferase (COMT)-mediated detoxification of B[a]P-7,8-catechol with Ro 410961 caused increased 8-oxo-dGuo formation in the H358 cell DNA.
Figures
Similar articles
-
Evidence for the aldo-keto reductase pathway of polycyclic aromatic trans-dihydrodiol activation in human lung A549 cells.Proc Natl Acad Sci U S A. 2008 May 13;105(19):6846-51. doi: 10.1073/pnas.0802776105. Epub 2008 May 12. Proc Natl Acad Sci U S A. 2008. PMID: 18474869 Free PMC article.
-
Aryl hydrocarbon receptor facilitates DNA strand breaks and 8-oxo-2'-deoxyguanosine formation by the aldo-keto reductase product benzo[a]pyrene-7,8-dione.J Biol Chem. 2009 Oct 23;284(43):29725-34. doi: 10.1074/jbc.M109.042143. Epub 2009 Sep 2. J Biol Chem. 2009. PMID: 19726680 Free PMC article.
-
8-Oxo-2'-deoxyguanosine as a biomarker of tobacco-smoking-induced oxidative stress.Free Radic Biol Med. 2012 Aug 1;53(3):610-7. doi: 10.1016/j.freeradbiomed.2012.04.006. Epub 2012 May 18. Free Radic Biol Med. 2012. PMID: 22613262 Free PMC article.
-
Chemical and biological consequences of oxidatively damaged guanine in DNA.Free Radic Res. 2012 Apr;46(4):420-41. doi: 10.3109/10715762.2011.653968. Epub 2012 Feb 22. Free Radic Res. 2012. PMID: 22239655 Free PMC article. Review.
-
8-hydroxy-2' -deoxyguanosine (8-OHdG): A critical biomarker of oxidative stress and carcinogenesis.J Environ Sci Health C Environ Carcinog Ecotoxicol Rev. 2009 Apr;27(2):120-39. doi: 10.1080/10590500902885684. J Environ Sci Health C Environ Carcinog Ecotoxicol Rev. 2009. PMID: 19412858 Review.
Cited by
-
Single Cell Determination of 7,8-dihydro-8-oxo-2'-deoxyguanosine by Fluorescence Techniques: Antibody vs. Avidin Labeling.Molecules. 2023 May 25;28(11):4326. doi: 10.3390/molecules28114326. Molecules. 2023. PMID: 37298802 Free PMC article.
-
Identification of stable benzo[a]pyrene-7,8-dione-DNA adducts in human lung cells.Chem Res Toxicol. 2013 May 20;26(5):685-92. doi: 10.1021/tx300476m. Epub 2013 Apr 26. Chem Res Toxicol. 2013. PMID: 23587017 Free PMC article.
-
Analysis of 8-oxo-7,8-dihydro-2'-deoxyguanosine by ultra high pressure liquid chromatography-heat assisted electrospray ionization-tandem mass spectrometry.J Chromatogr B Analyt Technol Biomed Life Sci. 2010 Feb 1;878(3-4):375-80. doi: 10.1016/j.jchromb.2009.12.004. Epub 2009 Dec 6. J Chromatogr B Analyt Technol Biomed Life Sci. 2010. PMID: 20022307 Free PMC article.
-
Molecular Mechanisms of Action of Selected Substances Involved in the Reduction of Benzo[a]pyrene-Induced Oxidative Stress.Molecules. 2022 Feb 18;27(4):1379. doi: 10.3390/molecules27041379. Molecules. 2022. PMID: 35209168 Free PMC article. Review.
-
Reconciliation of chemical, enzymatic, spectroscopic and computational data to assign the absolute configuration of the DNA base lesion spiroiminodihydantoin.J Am Chem Soc. 2013 Dec 4;135(48):18191-204. doi: 10.1021/ja409254z. Epub 2013 Nov 21. J Am Chem Soc. 2013. PMID: 24215588 Free PMC article.
References
-
- Gackowski D.; Rozalski R.; Siomek A.; Dziaman T.; Nicpon K.; Klimarczyk M.; Araszkiewicz A.; Olinski R. (2008) Oxidative stress and oxidative DNA damage is characteristic for mixed Alzheimer disease/vascular dementia. J. Neurol. Sci. 266, 57–62. - PubMed
-
- Nakabeppu Y.; Tsuchimoto D.; Yamaguchi H.; Sakumi K. (2007) Oxidative damage in nucleic acids and Parkinson’s disease. J. Neurosci. Res. 85, 919–934. - PubMed
-
- Collins A. R.; Gedik C. M.; Olmedilla B.; Southon S.; Bellizzi M. (1998) Oxidative DNA damage measured in human lymphocytes: large differences between sexes and between countries, and correlations with heart disease mortality rates. FASEB J. 12, 1397–1400. - PubMed
-
- Lee S. H.; Blair I. A. (2001) Oxidative DNA damage and cardiovascular disease. Trends Cardiovasc. Med. 11, 148–155. - PubMed
Publication types
MeSH terms
Substances
Grants and funding
LinkOut - more resources
Full Text Sources
Other Literature Sources
Research Materials
Miscellaneous
