. 2009 Mar 23:7:20.
doi: 10.1186/1479-5876-7-20.

MicroRNA and gene expression patterns in the differentiation of human embryonic stem cells

Affiliations

MicroRNA and gene expression patterns in the differentiation of human embryonic stem cells

Jiaqiang Ren et al. J Transl Med. .

Abstract

Background: The unique features of human embryonic stem (hES) cells make them the best candidate resource for both cell replacement therapy and development research. However, the molecular mechanisms responsible for the simultaneous maintenance of their self-renewal properties and undifferentiated state remain unclear. Non-coding microRNAs (miRNA) which regulate mRNA cleavage and inhibit encoded protein translation exhibit temporal or tissue-specific expression patterns and they play an important role in development timing.

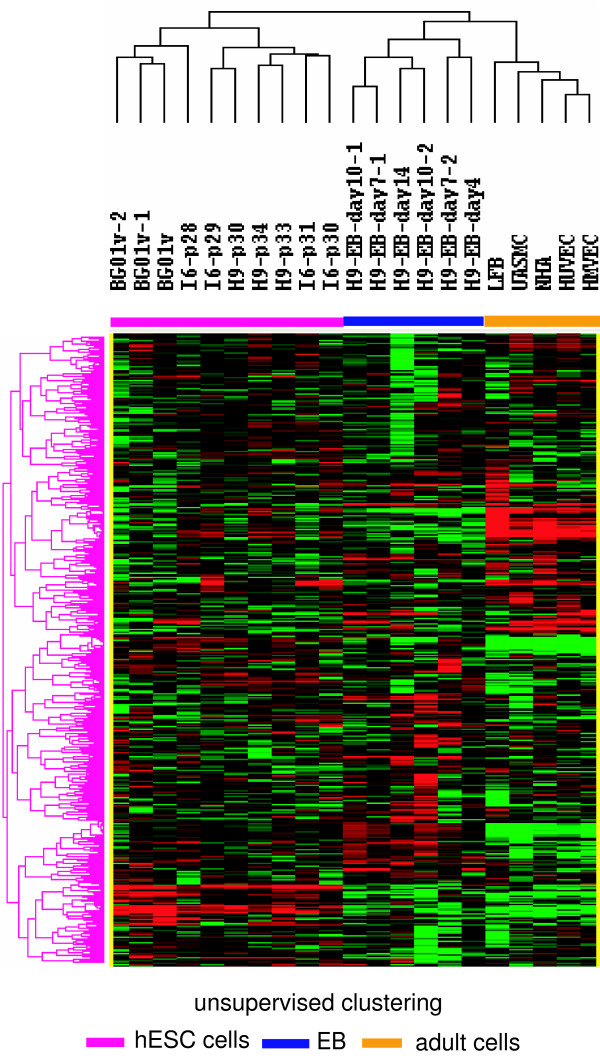
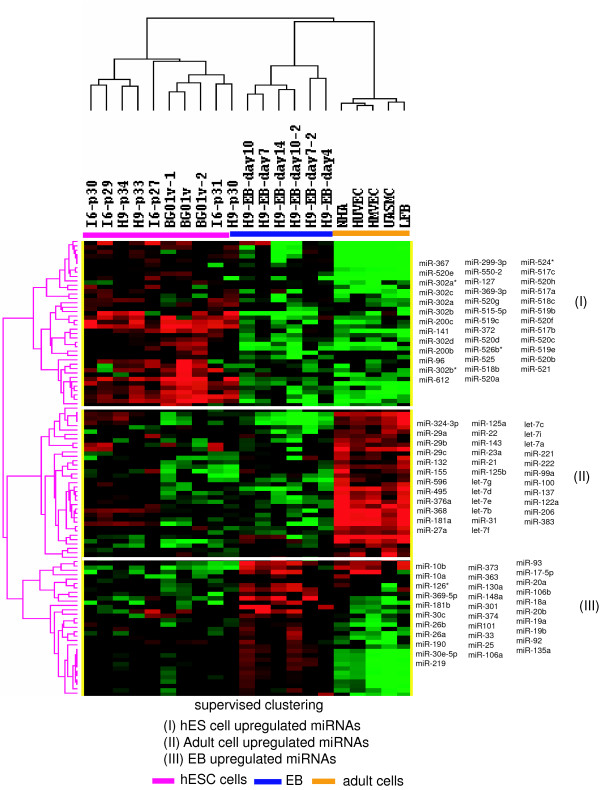
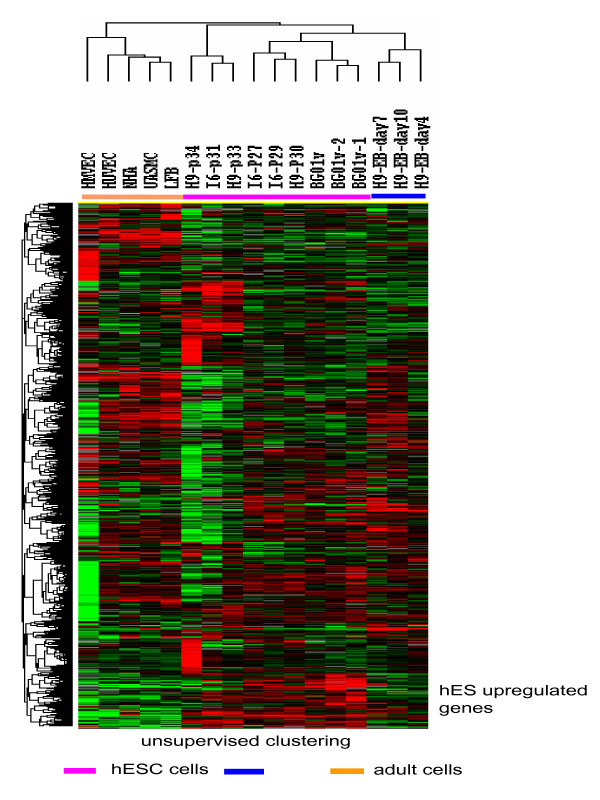
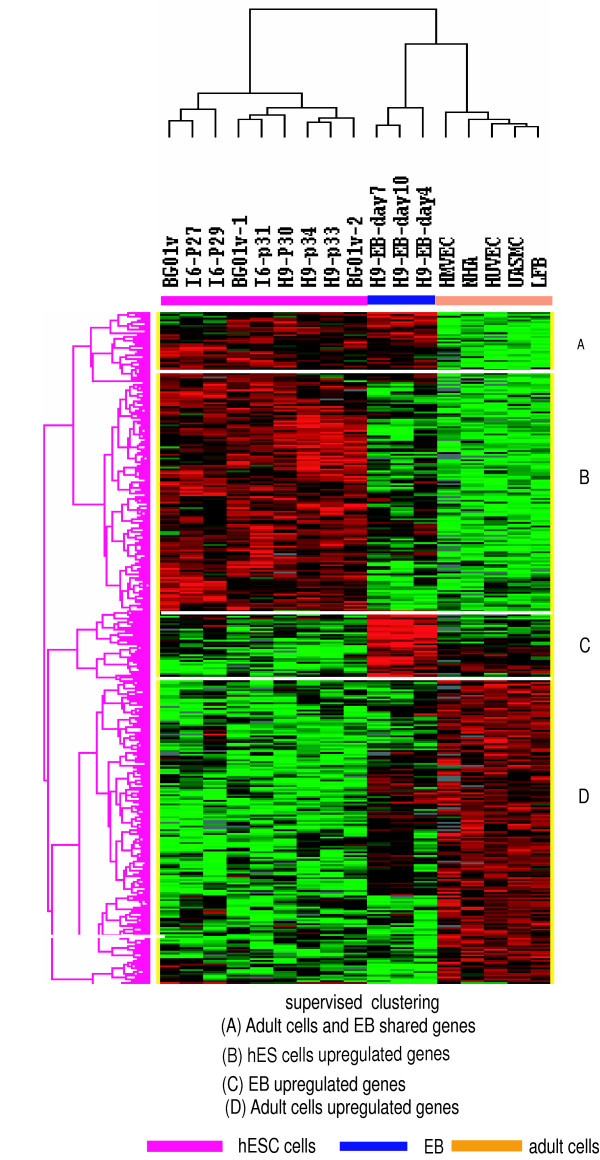
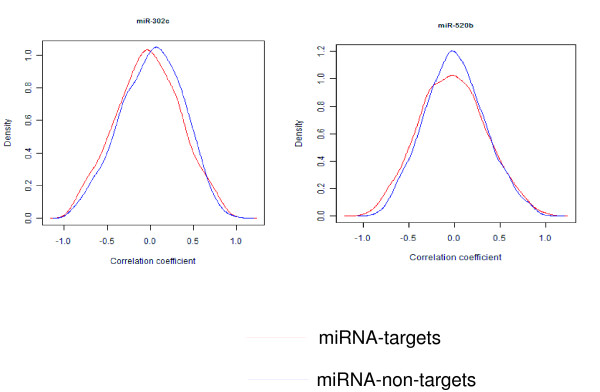
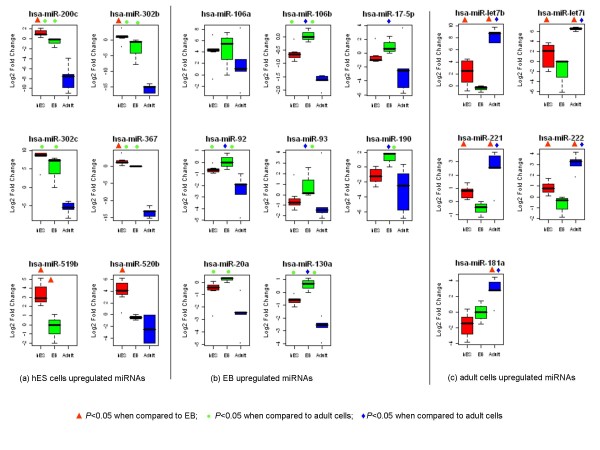
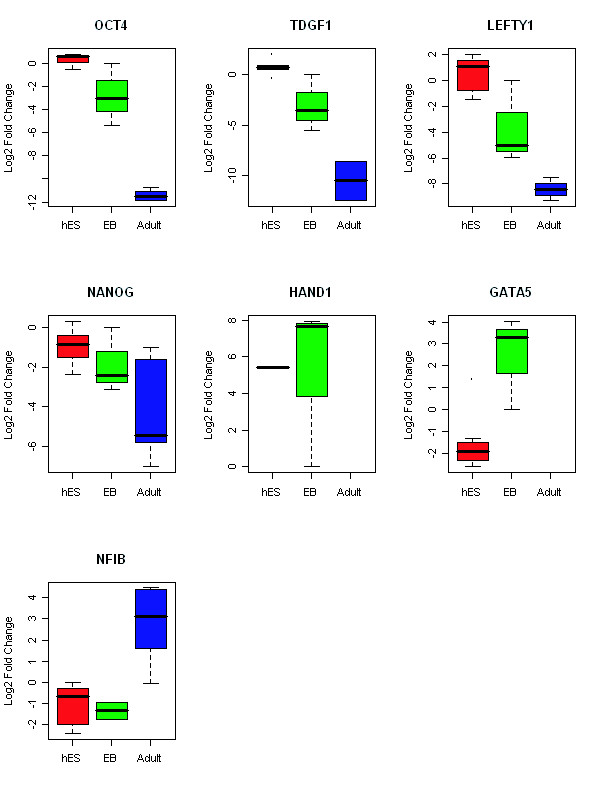
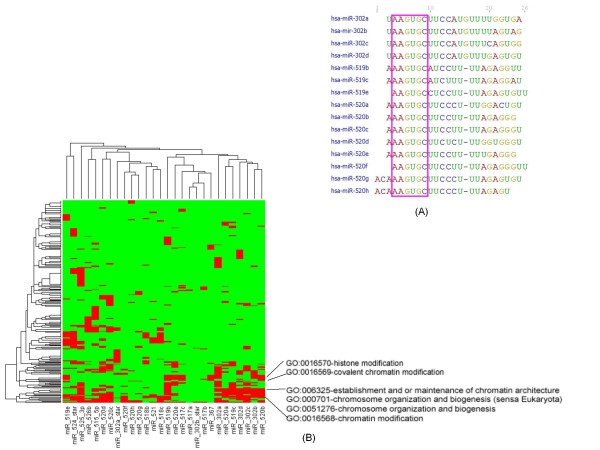
Results: In this study, we analyzed miRNA and gene expression profiles among samples from 3 hES cell lines (H9, I6 and BG01v), differentiated embryoid bodies (EB) derived from H9 cells at different time points, and 5 adult cell types including Human Microvascular Endothelial Cells (HMVEC), Human Umbilical Vein Endothelial Cells (HUVEC), Umbilical Artery Smooth Muscle Cells (UASMC), Normal Human Astrocytes (NHA), and Lung Fibroblasts (LFB). This analysis rendered 104 miRNAs and 776 genes differentially expressed among the three cell types. Selected differentially expressed miRNAs and genes were further validated and confirmed by quantitative real-time-PCR (qRT-PCR). Especially, members of the miR-302 cluster on chromosome 4 and miR-520 cluster on chromosome 19 were highly expressed in undifferentiated hES cells. MiRNAs in these two clusters displayed similar expression levels. The members of these two clusters share a consensus 7-mer seed sequence and their targeted genes had overlapping functions. Among the targeted genes, genes with chromatin structure modification function are enriched suggesting a role in the maintenance of chromatin structure. We also found that the expression level of members of the two clusters, miR-520b and miR-302c, were negatively correlated with their targeted genes based on gene expression analysis

Conclusion: We identified the expression patterns of miRNAs and gene transcripts in the undifferentiation of human embryonic stem cells; among the miRNAs that are highly expressed in undifferentiated embryonic stem cells, the miR-520 cluster may be closely involved in hES cell function and its relevance to chromatin structure warrants further study.


Figures

Figure 1
Figure 1
Unsupervised hierarchical clustering of miRNAs. The expression levels of miRNAs were presented as normalized cy5/cy3 ratios, upregulated miRNAs were shown as red and downregulated miRNAs were shown as green. I6, H9 and BG01v are names of human embryonic stem (hES) cells lines. P denoted the number of passages of the cell lines. H9-EB denoted embryoid body (EB) prepared from cell line H9 and the day indicates the time in culture. HMVEC = human microvascular endothelial cells, HUVEC = human umbilical vein endothelial cells, UASMC = umbilical artery smooth muscle cells; NHA = normal astrocyte and LFB = lung fibroblasts. Unsupervised hierarchical clustering analysis separated the samples to three major groups: hES cells, embryoid body (EB), and adult cells.
Figure 2
Figure 2
supervised hierarchical clustering of miRNAs. Supervised clustering using the 104 differentially expressed miRNAs classified the samples into three groups as well: hES, EB, and adult cells. Node I contained the miRNAs that were upregulated in hES cells, node II contained the miRNAs upregulated in adult cells, node III contained the miRNAs upregulated in EB. HMVEC = human microvascular endothelial cells, HUVEC = human umbilical vein endothelial cells, UASMC = umbilical artery smooth muscle cells; NHA = normal astrocyte and LFB = lung fibroblasts.
Figure 3
Figure 3
unsupervised hierarchical clustering of genes. The gene expression data is presented as normalized Log cy5/cy3 ratios, upregulated genes are shown as red, downregulated genes are shown as green. I6, H9 and BG01v are names of hES cells lines. P denotes the number of passages of the cell lines. H9-EB denotes embryoid body (EB) prepared from cell line H9 and the day indicates the time in culture. HMVEC = human microvascular endothelial cells, HUVEC = human umbilical vein endothelial cells, UASMC = umbilical artery smooth muscle cells; NHA = normal astrocyte and LFB = lung fibroblasts. Unsupervised hierarchical clustering analysis separated the samples to three major groups: hES cells, embryoid body (EB), and adult cells; the node containing hES markers was highlighted by white lines.
Figure 4
Figure 4
supervised hierarchical clustering of genes. Supervised clustering using the differentially expressed gene classified the samples into three groups: hES cells, EB, and adult cells. Node A contained the genes that were upregulated in both hES cells and EB, node B contained the genes upregulated in hES cells only, node C contained the genes upregulated in EB only, and node D contained the genes that were upregulated in adult cells. HMVEC = human microvascular endothelial cells, HUVEC = human umbilical vein endothelial cells, UASMC = umbilical artery smooth muscle cells; NHA = normal astrocyte and LFB = lung fibroblasts.
Figure 5
Figure 5
Correlation coefficients of miRNA-target gene pairs. The expression of miR-302c and miR-502b and their predicted target genes was analyzed by correlation analysis. The distribution of the correlation coefficients for miR-302c-target gene pairs (red line) was shifted toward negative side compared to that of the miR-302c-non-target gene pairs (blue line). The mean of correlation coefficients between the two sets was significantly different (p = 0.0003). The distribution of correlation coefficients for miR-520b-target gene pairs (red line) was also shifted toward negative side compared to the miR-520b-non-target gene pairs (blue line) and the mean of correlation coefficients was significant (p = 0.049).
Figure 6
Figure 6
Measurement of differentially expressed miRNAs by qRT-PCR. The differentially expressed miRNAs were analyzed by qRT-PCR using the relative quantification method. The results were normalized with endogenous control RNU48 and the fold change was calculated by equation2-ΔΔCt. The y-axis indicates the Log2-transformed fold change relative to the calibrator. Expression of levels of miR-200c, miR-302b, miR-302c, miR-367, miR-519b, and miR-520b were the greatest in hES cells (panel A). The expression of miR-106a, miR-106b, miR-17-5p, miR-92, miR-93, miR-190, miR-20a and miR-130 were highest in EB (panel B). Tumor suppressor let-7b/7i, miR-221, miR-222 and miR-181a were expressed at the highest levels in adult cells (panel C). Statistical significance was determined by student t-test. Red triangles indicate a significant difference (P < 0.05) versus EB, green circles indicate a significant difference (P < 0.05) versus adult cells, and blue diamonds indicate a significant difference (P < 0.05) versus hES cells.
Figure 7
Figure 7
Measurement of differentially expressed genes byqRT-PCR. Quantitative real-time PCR confirmed the expression of 3 genes found by microarray analysis to be upregulated in hES: POU5F1 (OCT4), LEFTY1, and TDGF1, and 2 genes upregulated in EB: HAND1 and GATA5, and 1 gene upregulated in adult cells: NFIB. In addition, the levels of another hES cell marker Nanog was also measured. The results were normalized by endogenous control 18s rRNA and the fold change was calculated by equation2-ΔΔCt. The y-axis indicates the Log2-transformed fold change relative to the calibrator.
Figure 8
Figure 8
Sequence and GO analysis of the miR-302 cluster and miR-520 cluster. The members of the miR-302 and miR-520 clusters had similar sequences; they shared a consensus seed sequence: AAGUGC (panel A, seed sequence is highlighted by the purple rectangle). At the Gene Ontology level, miR-520b, miR-302b, miR-302c, miR-302d, miR-519c, miR-520a, and miR-302a formed a cluster (significant GO terms shown as red), and they shared GO terms related to chromatin structure modifications (Panel B).

References

    1. Bartel DP. MicroRNAs: genomics, biogenesis, mechanism, and function. Cell. 2004;116:281–297. doi: 10.1016/S0092-8674(04)00045-5. - DOI - PubMed
    1. Carrington JC, Ambros V. Role of microRNAs in plant and animal development. Science. 2003;301:336–338. doi: 10.1126/science.1085242. - DOI - PubMed
    1. Olsen PH, Ambros V. The lin-4 regulatory RNA controls developmental timing in Caenorhabditis elegans by blocking LIN-14 protein synthesis after the initiation of translation. Dev Biol. 1999;216:671–680. doi: 10.1006/dbio.1999.9523. - DOI - PubMed
    1. Seggerson K, Tang L, Moss EG. Two genetic circuits repress the Caenorhabditis elegans heterochronic gene lin-28 after translation initiation. Dev Biol. 2002;243:215–225. doi: 10.1006/dbio.2001.0563. - DOI - PubMed
    1. Rhoades MW, Reinhart BJ, Lim LP, Burge CB, Bartel B, Bartel DP. Prediction of plant microRNA targets. Cell. 2002;110:513–520. doi: 10.1016/S0092-8674(02)00863-2. - DOI - PubMed

Publication types