

Liraglutide, a once-daily human GLP-1 analogue, added to a sulphonylurea over 26 weeks produces greater improvements in glycaemic and weight control compared with adding rosiglitazone or placebo in subjects with Type 2 diabetes (LEAD-1 SU)
- PMID: 19317822
- PMCID: PMC2871176
- DOI: 10.1111/j.1464-5491.2009.02666.x
Liraglutide, a once-daily human GLP-1 analogue, added to a sulphonylurea over 26 weeks produces greater improvements in glycaemic and weight control compared with adding rosiglitazone or placebo in subjects with Type 2 diabetes (LEAD-1 SU)
Abstract
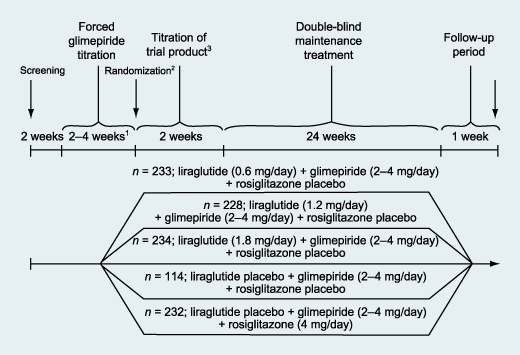
Aim: To compare the effects of combining liraglutide (0.6, 1.2 or 1.8 mg/day) or rosiglitazone 4 mg/day (all n >or= 228) or placebo (n = 114) with glimepiride (2-4 mg/day) on glycaemic control, body weight and safety in Type 2 diabetes.
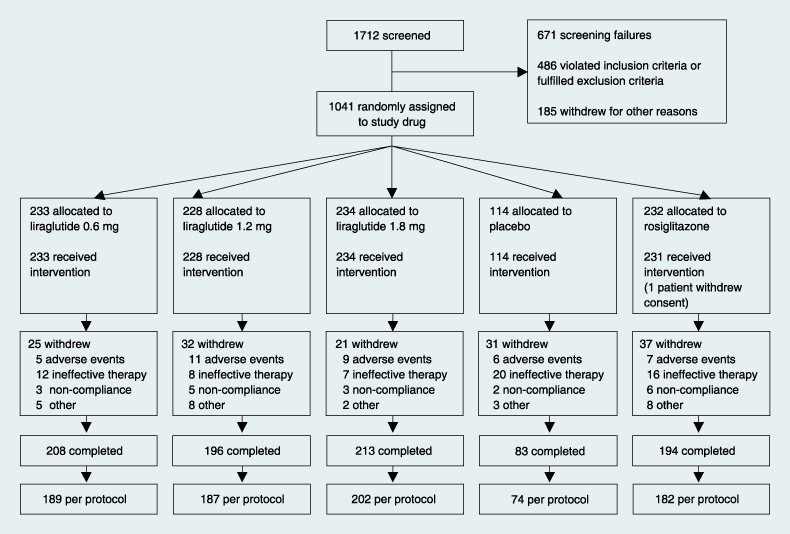
Methods: In total, 1041 adults (mean +/- sd), age 56 +/- 10 years, weight 82 +/- 17 kg and glycated haemoglobin (HbA(1c)) 8.4 +/- 1.0% at 116 sites in 21 countries were stratified based on previous oral glucose-lowering mono : combination therapies (30 : 70%) to participate in a five-arm, 26-week, double-dummy, randomized study.
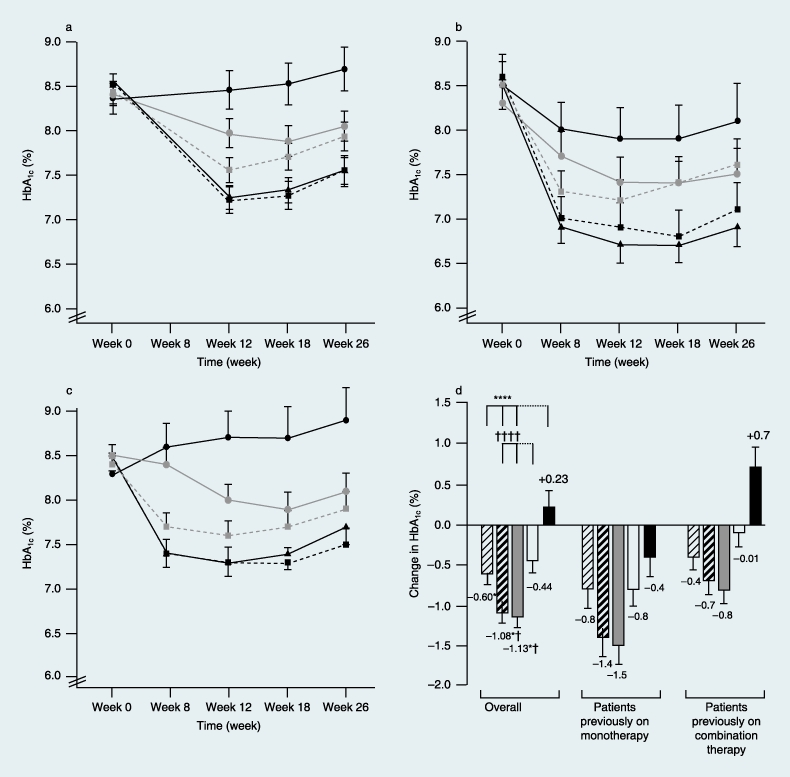
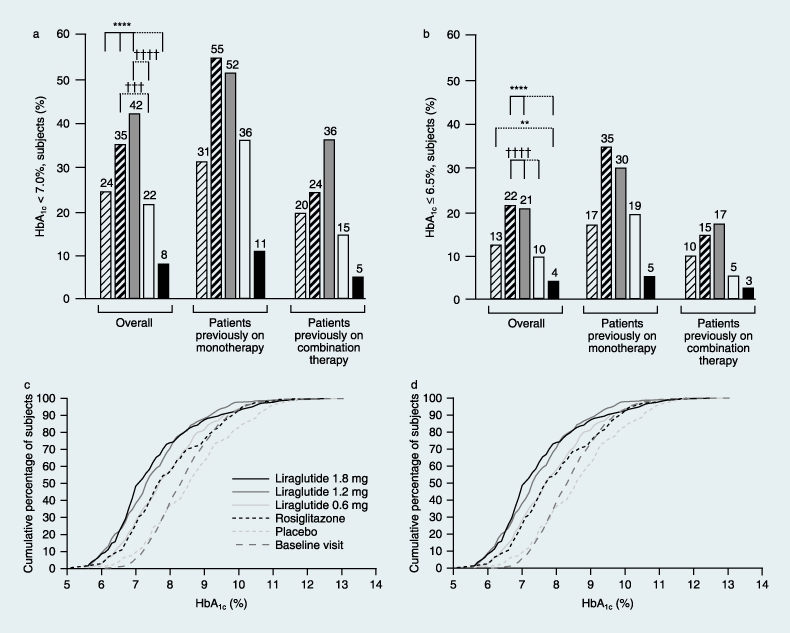
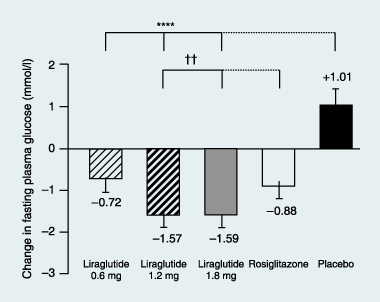
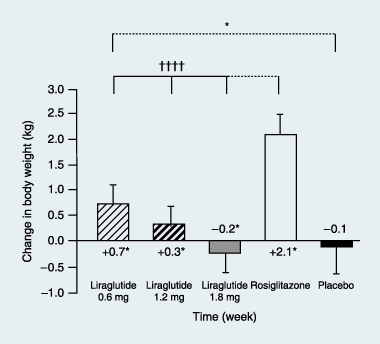
Results: Liraglutide (1.2 or 1.8 mg) produced greater reductions in HbA(1c) from baseline, (-1.1%, baseline 8.5%) compared with placebo (+0.2%, P < 0.0001, baseline 8.4%) or rosiglitazone (-0.4%, P < 0.0001, baseline 8.4%) when added to glimepiride. Liraglutide 0.6 mg was less effective (-0.6%, baseline 8.4%). Fasting plasma glucose decreased by week 2, with a 1.6 mmol/l decrease from baseline at week 26 with liraglutide 1.2 mg (baseline 9.8 mmol/l) or 1.8 mg (baseline 9.7 mmol/l) compared with a 0.9 mmol/l increase (placebo, P < 0.0001, baseline 9.5 mmol/l) or 1.0 mmol/l decrease (rosiglitazone, P < 0.006, baseline 9.9 mmol/l). Decreases in postprandial plasma glucose from baseline were greater with liraglutide 1.2 or 1.8 mg [-2.5 to -2.7 mmol/l (baseline 12.9 mmol/l for both)] compared with placebo (-0.4 mmol/l, P < 0.0001, baseline 12.7 mmol/l) or rosiglitazone (-1.8 mmol/l, P < 0.05, baseline 13.0 mmol/l). Changes in body weight with liraglutide 1.8 mg (-0.2 kg, baseline 83.0 kg), 1.2 mg (+0.3 kg, baseline 80.0 kg) or placebo (-0.1 kg, baseline 81.9 kg) were less than with rosiglitazone (+2.1 kg, P < 0.0001, baseline 80.6 kg). Main adverse events for all treatments were minor hypoglycaemia (< 10%), nausea (< 11%), vomiting (< 5%) and diarrhoea (< 8%).
Conclusions: Liraglutide added to glimepiride was well tolerated and provided improved glycaemic control and favourable weight profile.
Figures
References
-
- Holst JJ. The physiology of glucagon-like peptide 1. Physiol Rev. 2007;87:1409–1439. - PubMed
-
- Nathan DM, Buse JB, Davidson MB, Heine RJ, Holman RR, Sherwin R, et al. Management of hyperglycemia in Type 2 diabetes: a consensus algorithm for the initiation and adjustment of therapy: a consensus statement from the American Diabetes Association and the European Association for the Study of Diabetes. Diabetes Care. 2006;29:1963–1972. - PubMed
-
- Green J, Feinglos M. Update on Type 2 diabetes mellitus: understanding changes in the diabetes treatment paradigm. Int J Clin Pract. 2007;61:3–11. - PubMed
-
- Drucker DJ, Nauck MA. The incretin system: glucagon-like peptide-1 receptor agonists and dipeptidyl peptidase-4 inhibitors in Type 2 diabetes. Lancet. 2006;368:1696–1705. - PubMed
-
- Knudsen LB, Nielsen PF, Huusfeldt PO, Johansen NL, Madsen K, Pedersen FZ, et al. Potent derivatives of glucagon-like peptide-1 with pharmacokinetic properties suitable for once daily administration. J Med Chem. 2000;43:1664–1669. - PubMed
Publication types
MeSH terms
Substances
LinkOut - more resources
Full Text Sources
Other Literature Sources
Medical
Miscellaneous
