. 2009 Jun;109(5):1300-10.
doi: 10.1111/j.1471-4159.2009.06048.x. Epub 2009 Mar 20.

Interleukin-1beta enhances nucleotide-induced and alpha-secretase-dependent amyloid precursor protein processing in rat primary cortical neurons via up-regulation of the P2Y(2) receptor

Affiliations

Interleukin-1beta enhances nucleotide-induced and alpha-secretase-dependent amyloid precursor protein processing in rat primary cortical neurons via up-regulation of the P2Y(2) receptor

Qiongman Kong et al. J Neurochem. 2009 Jun.

Abstract

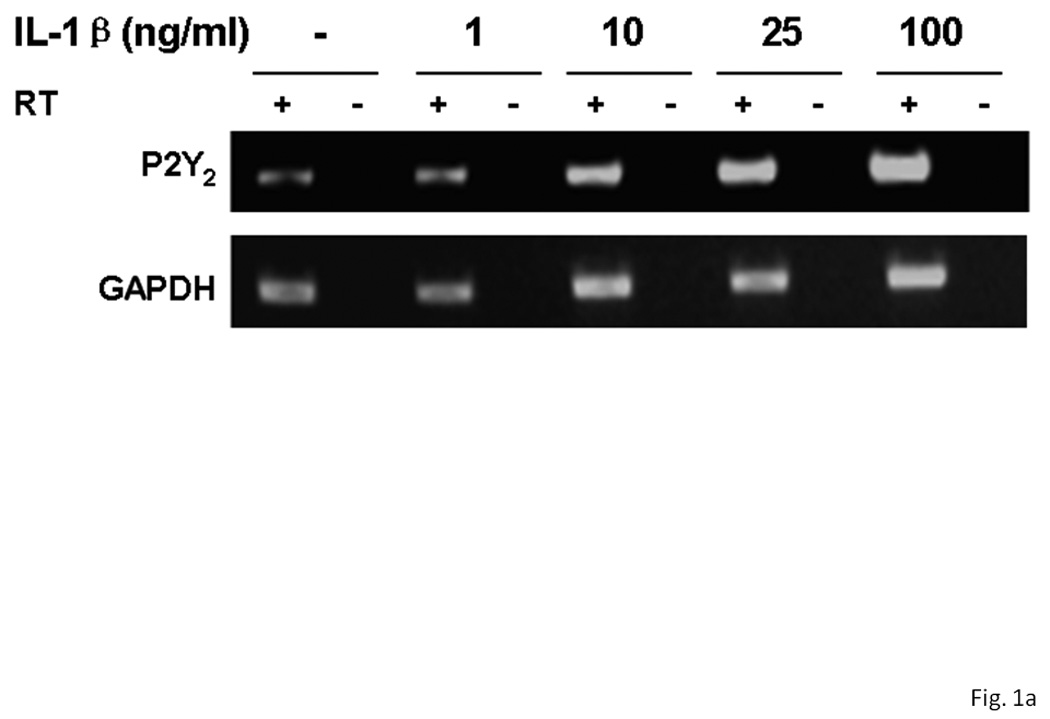
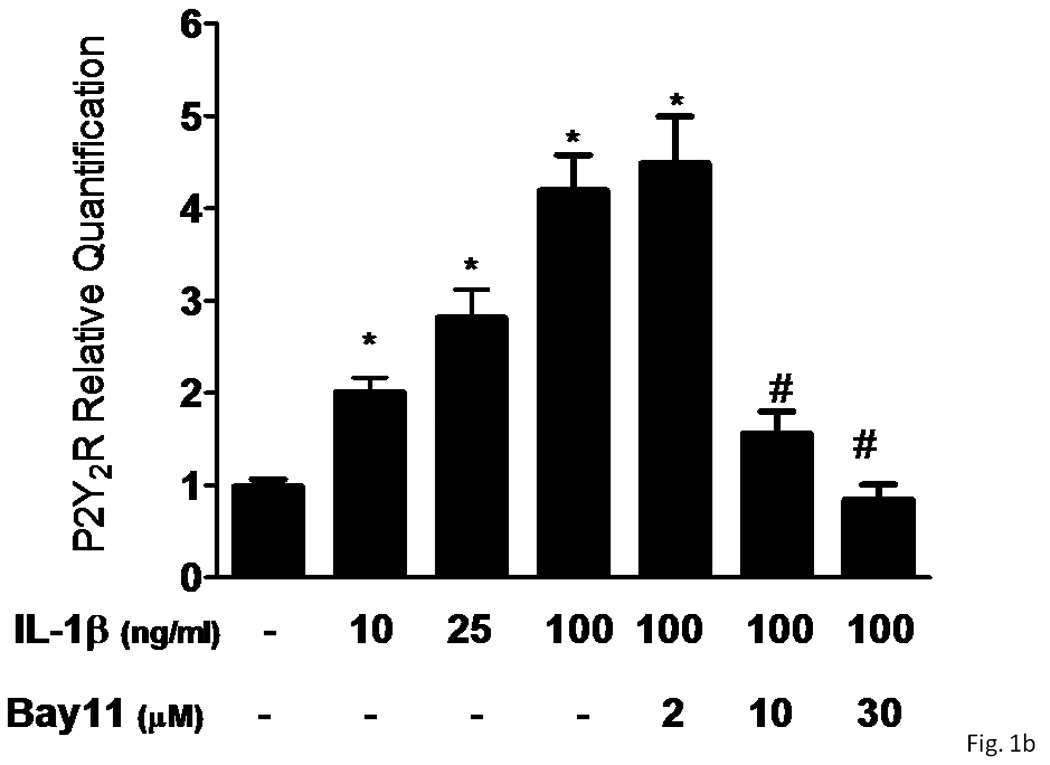
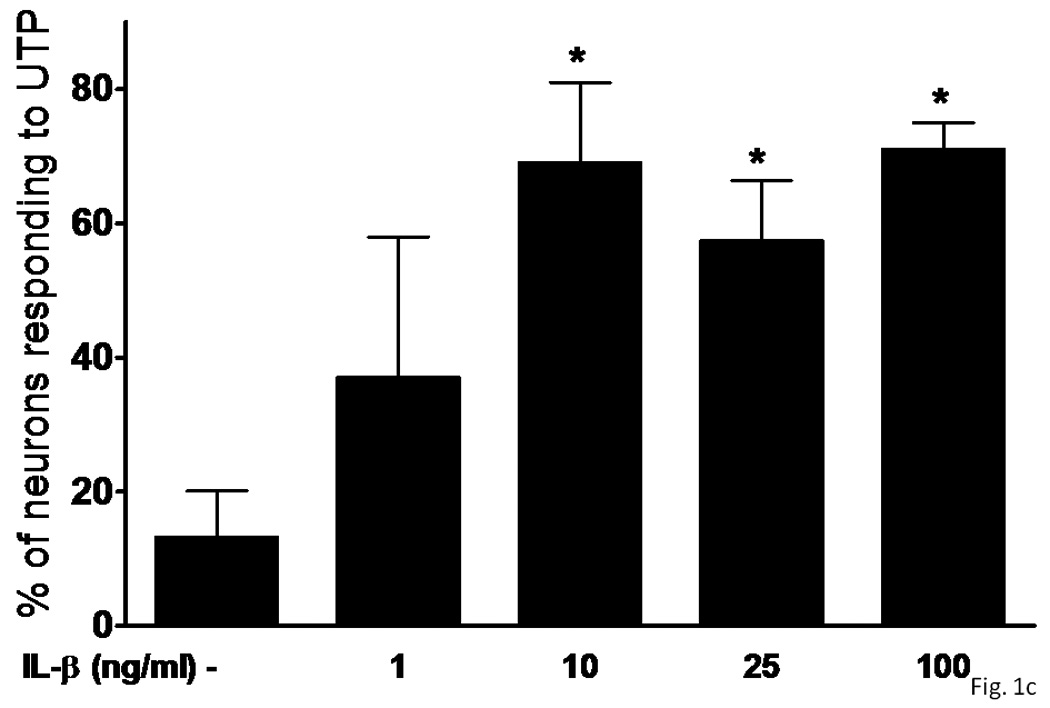
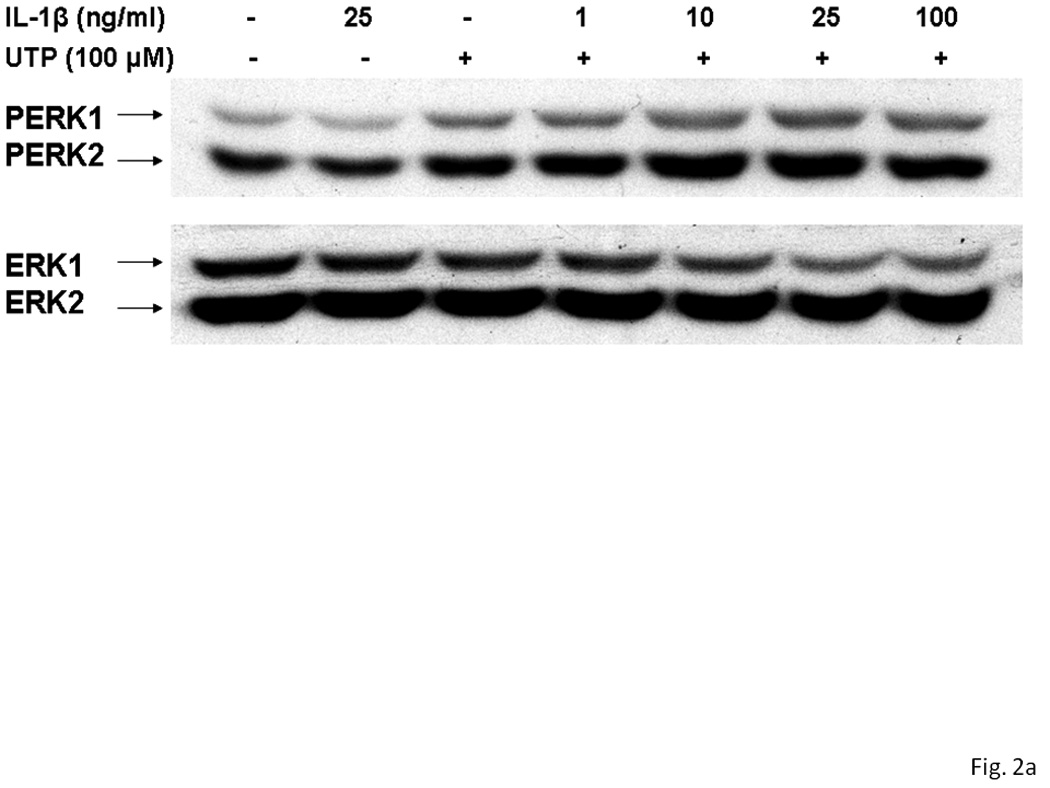
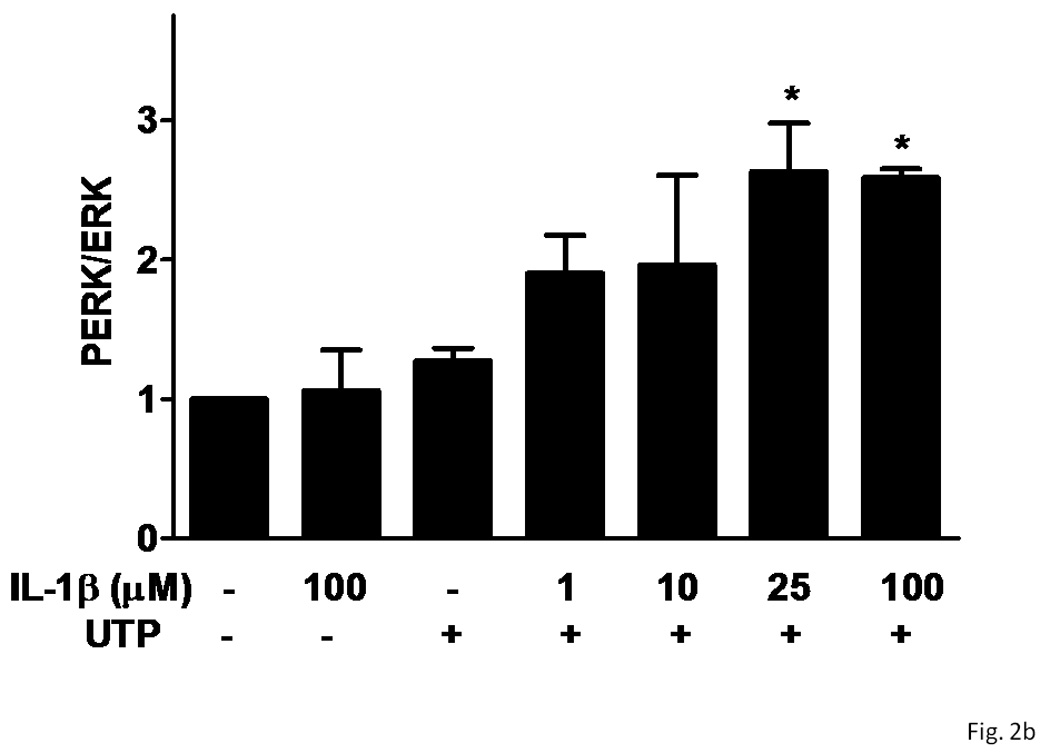
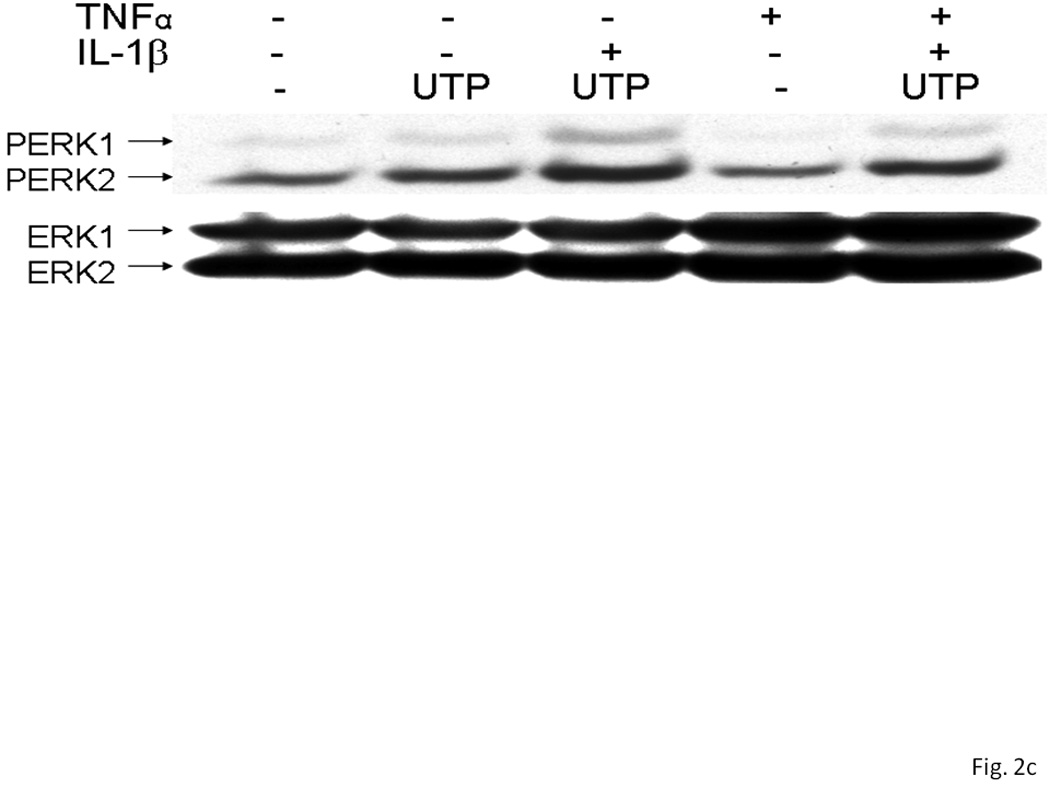
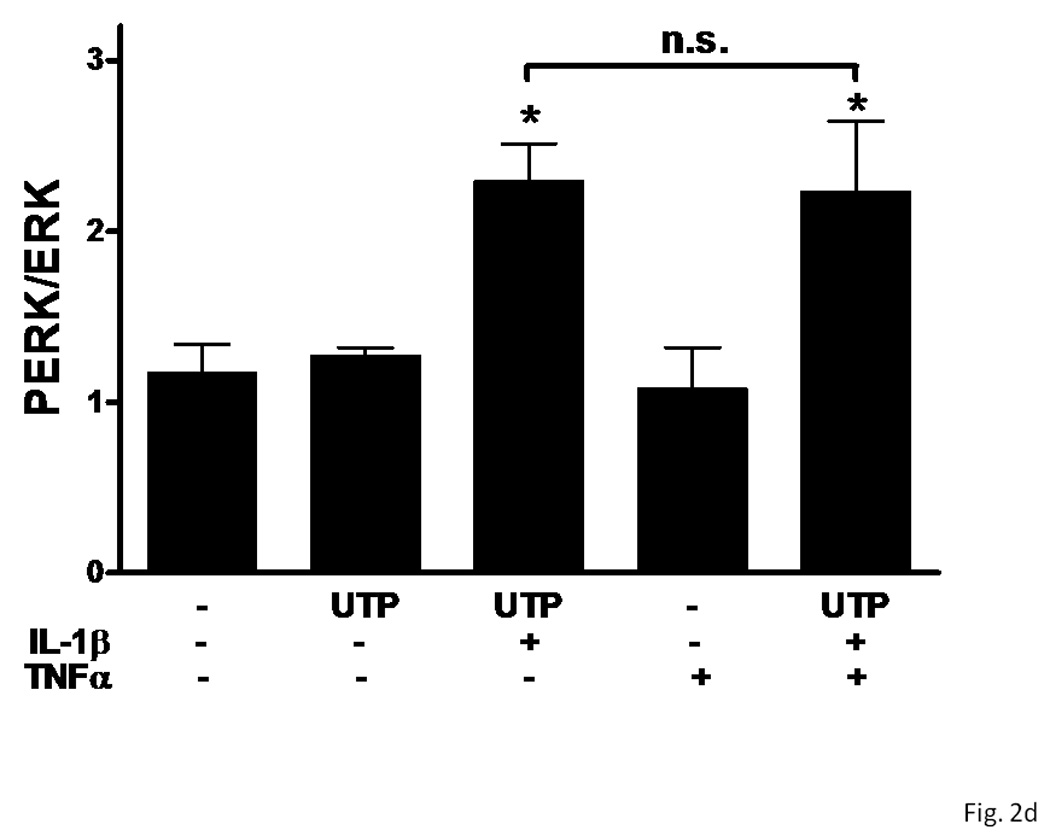
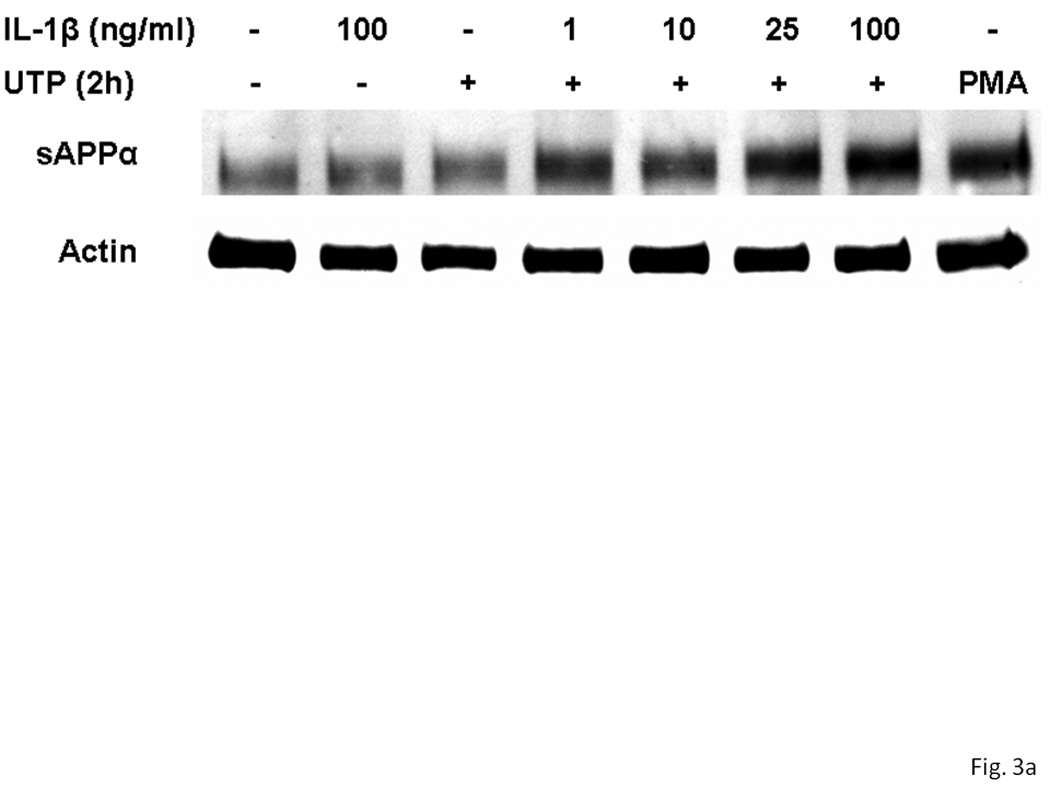
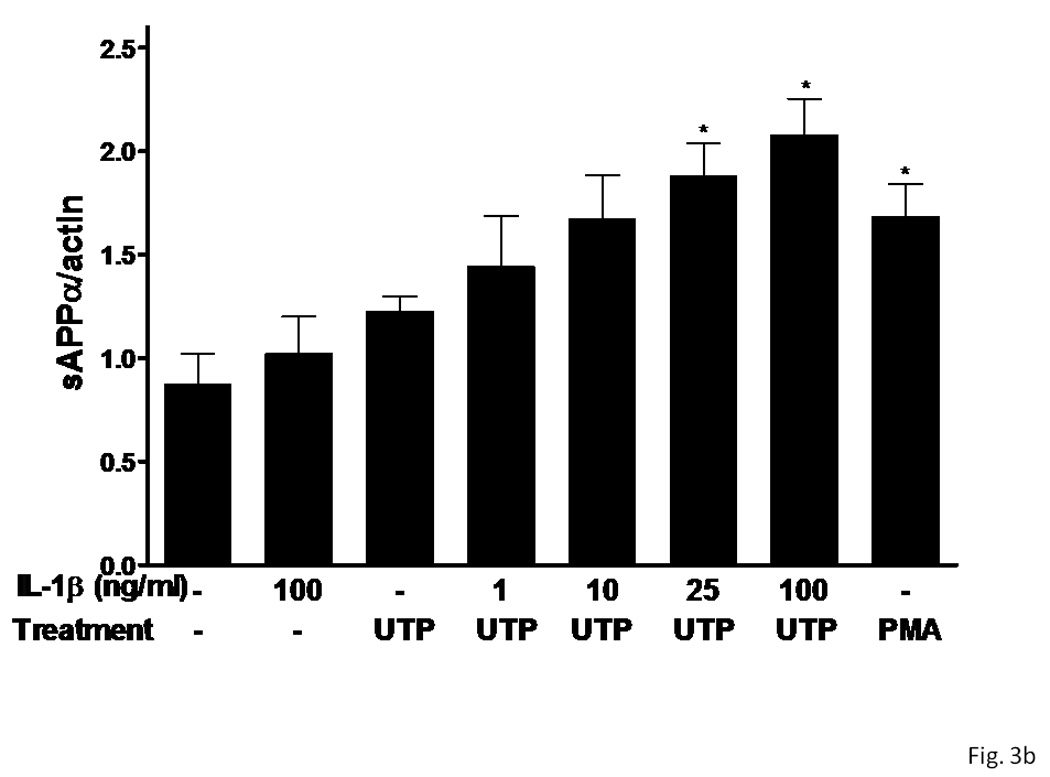
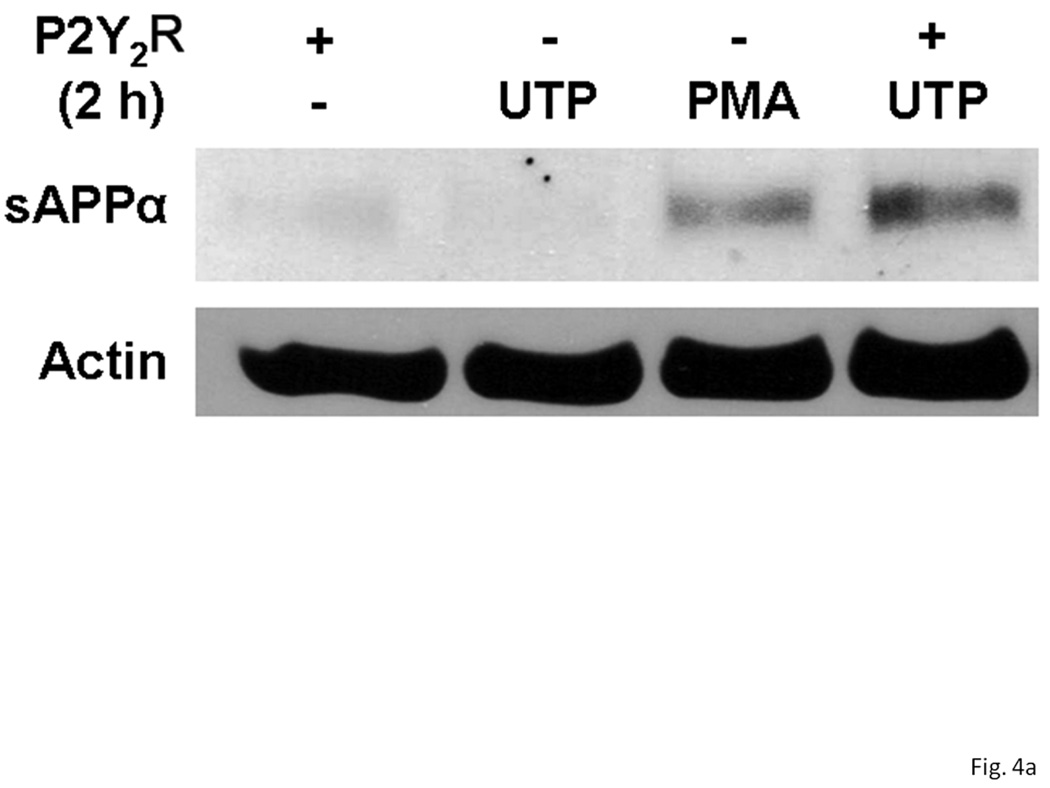
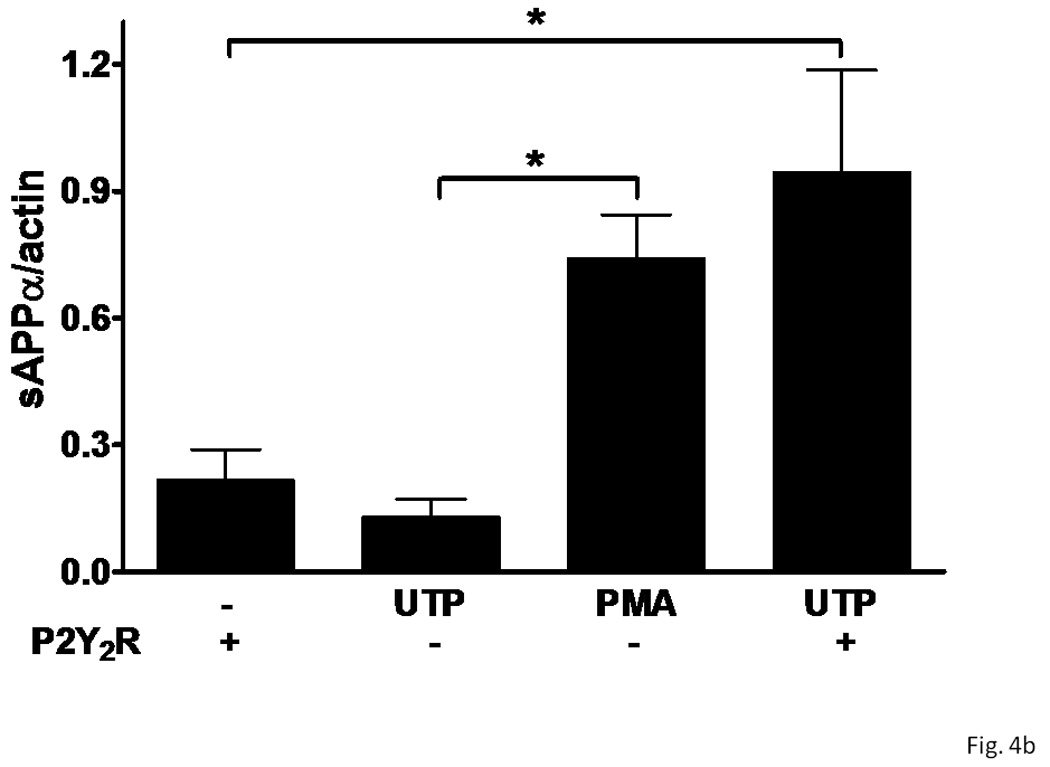
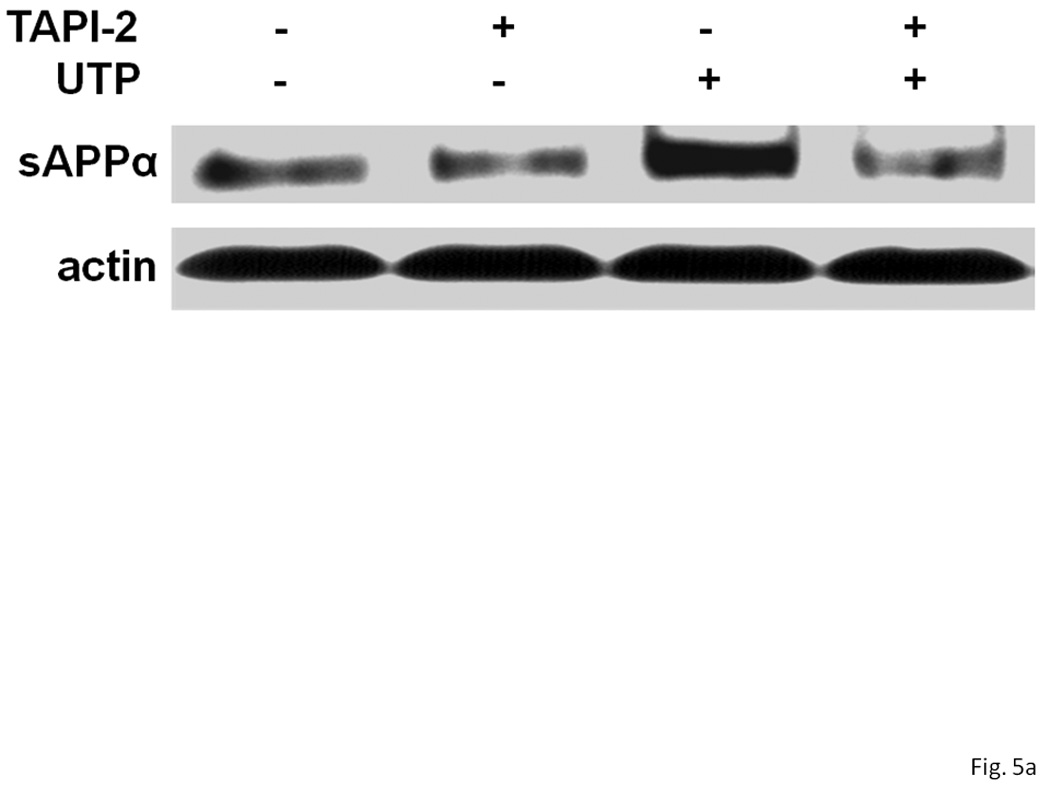
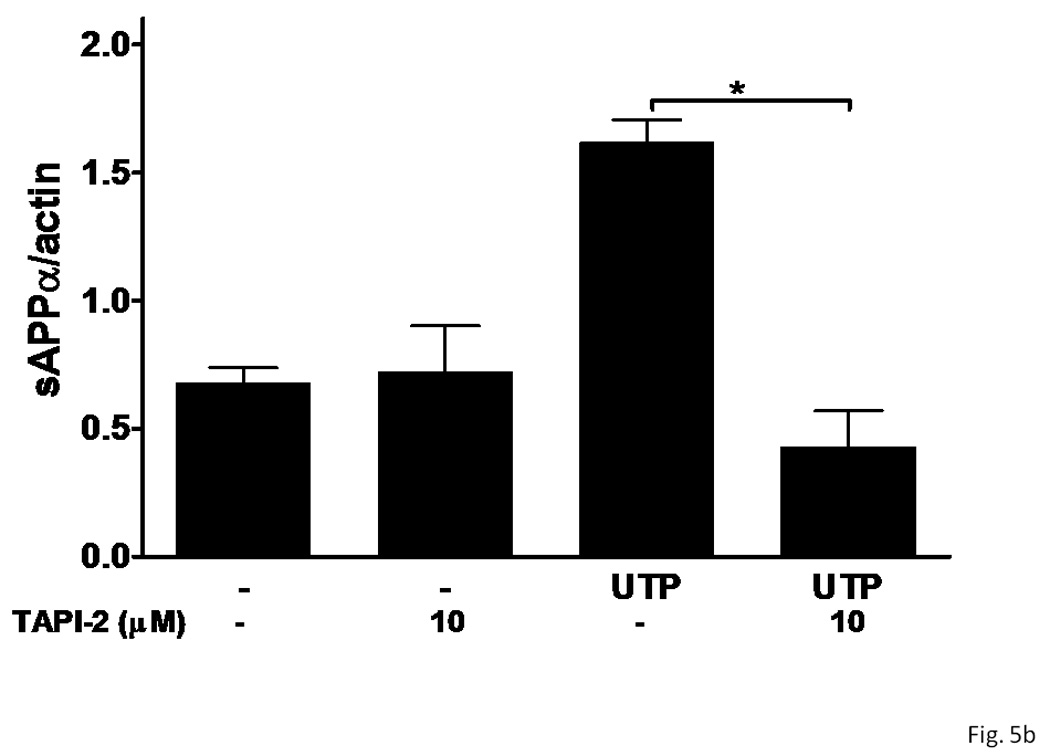
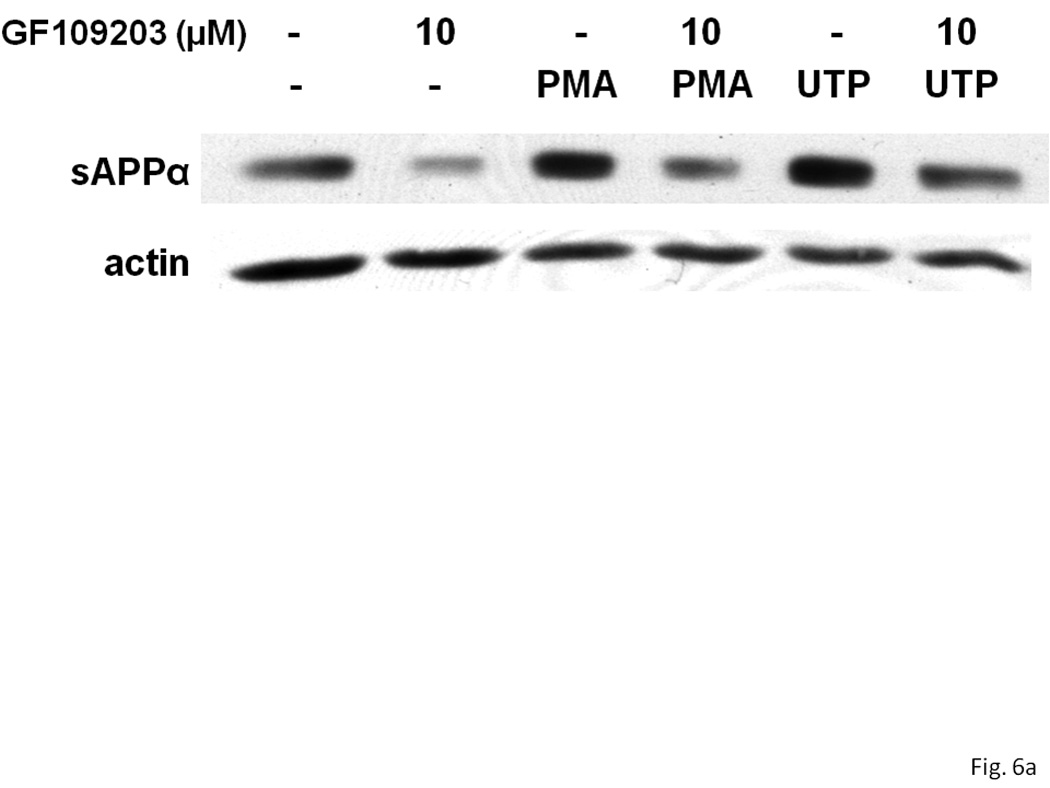
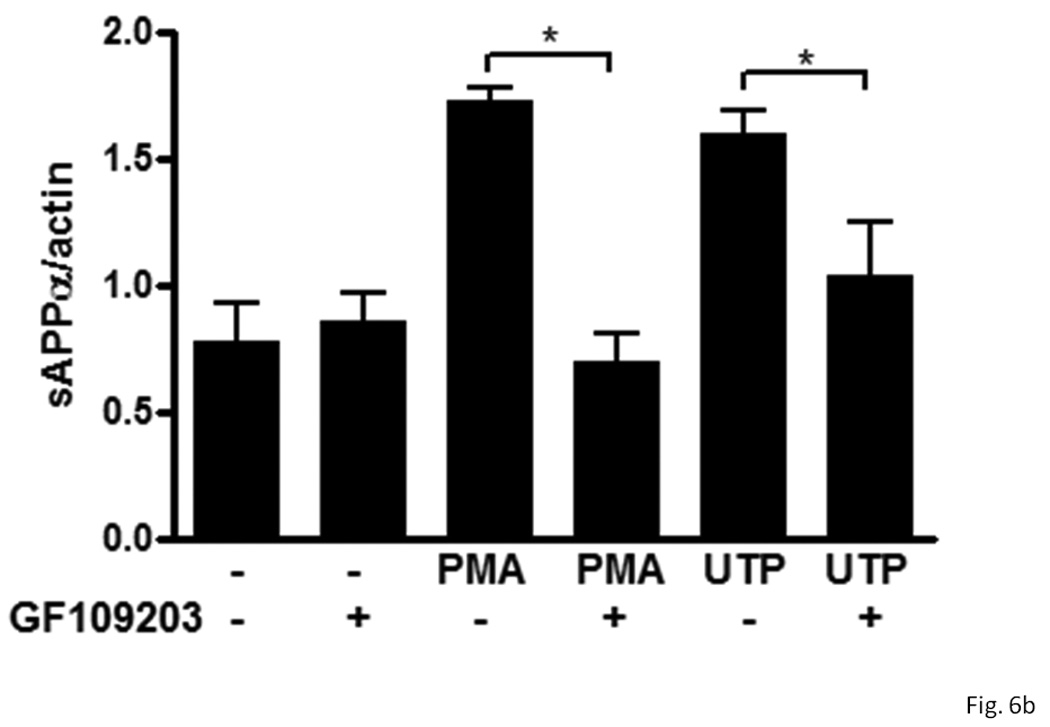
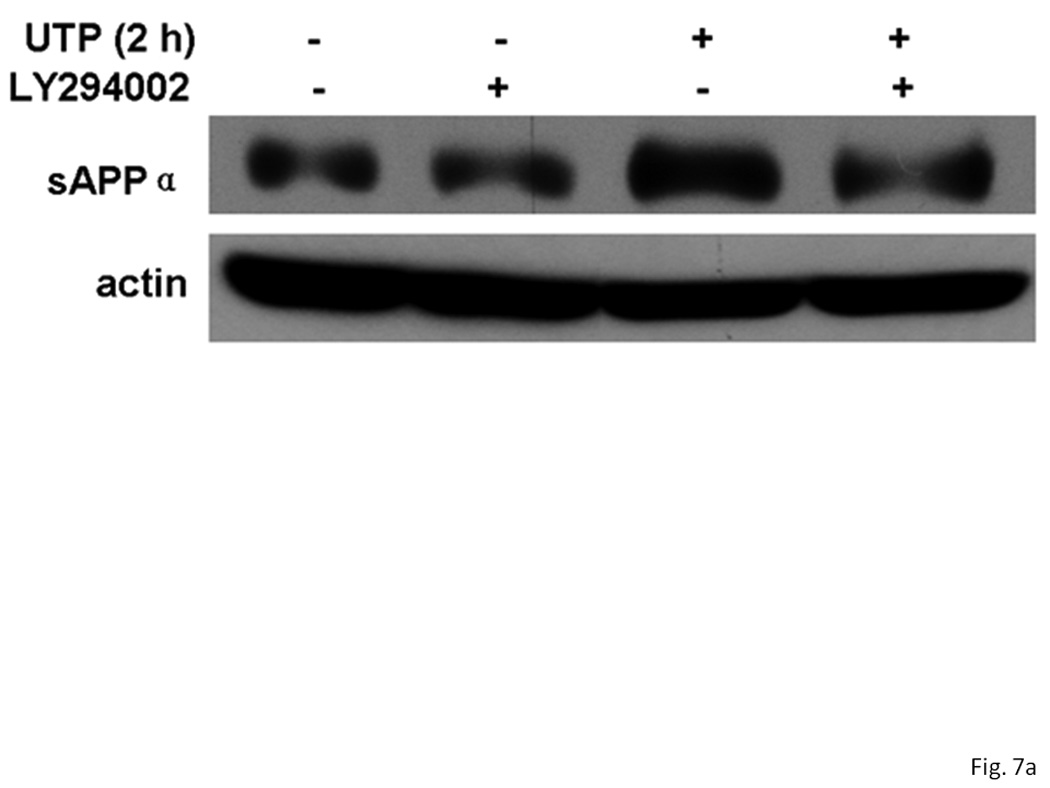
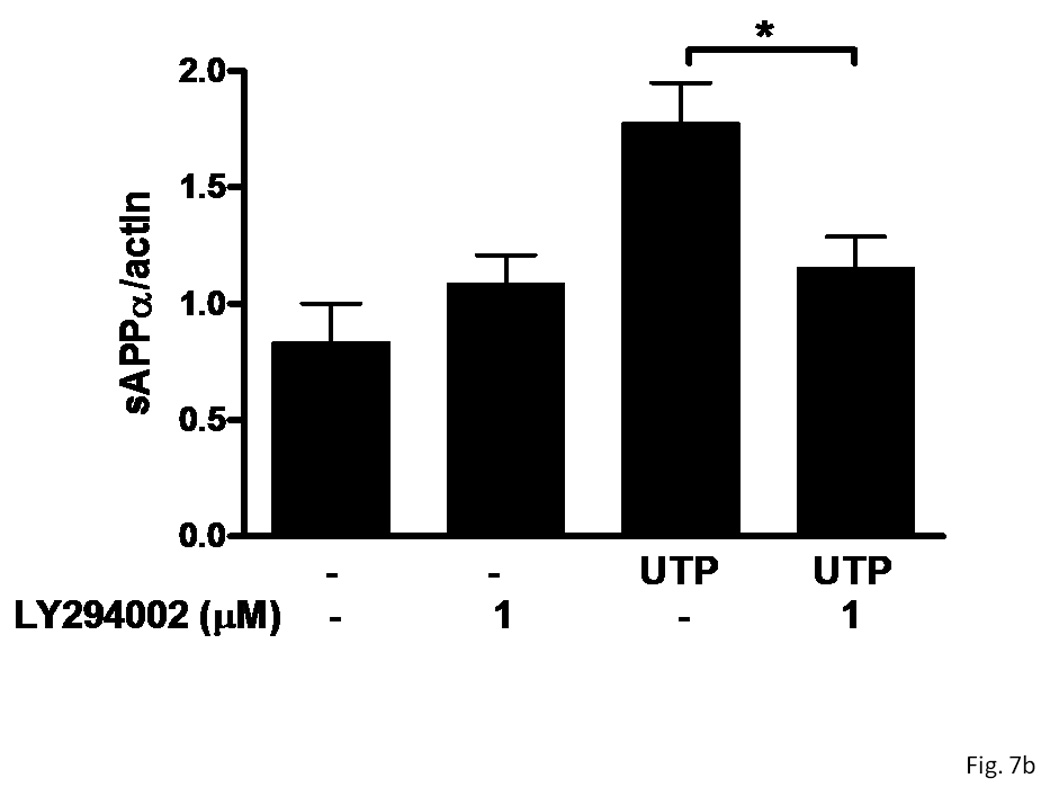
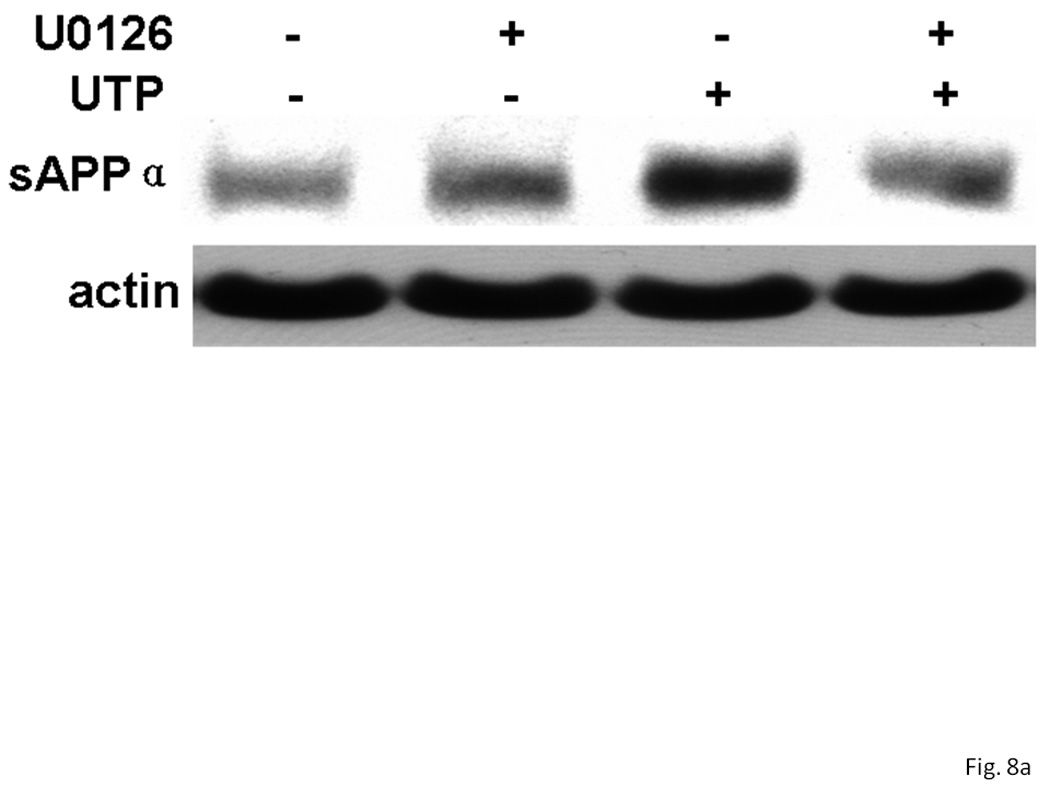
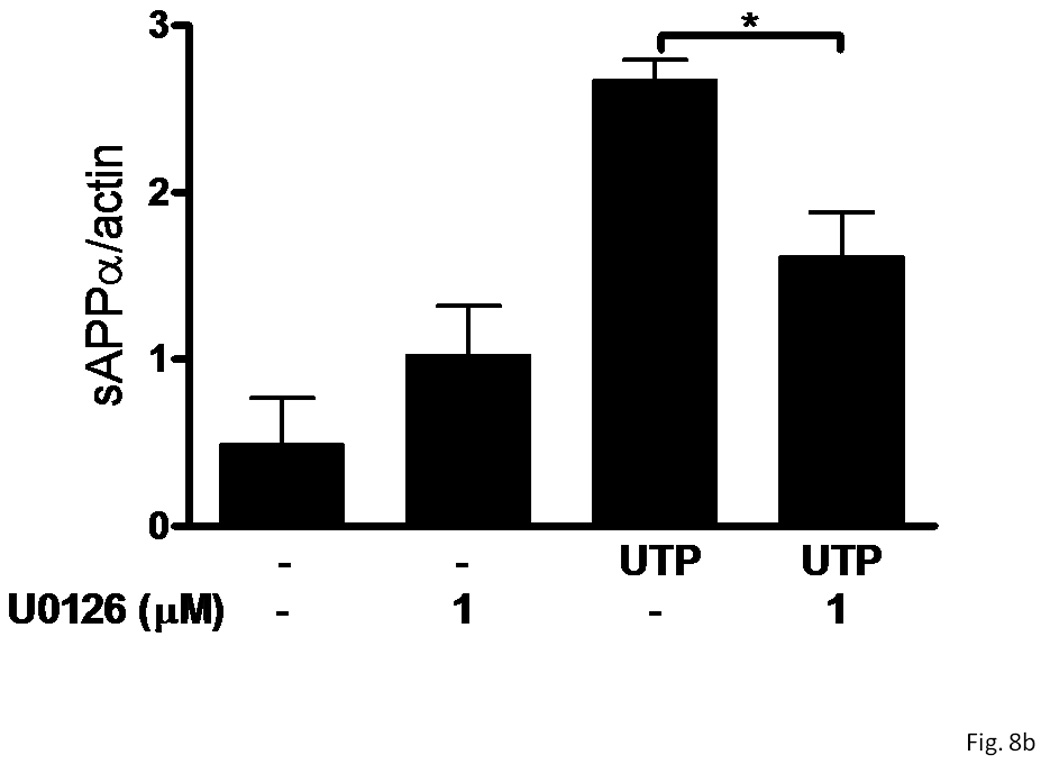
The heterologous expression and activation of the human P2Y(2) nucleotide receptor (P2Y(2)R) in human 1321N1 astrocytoma cells stimulates alpha-secretase-dependent cleavage of the amyloid precursor protein (APP), causing extracellular release of the non-amyloidogenic protein secreted amyloid precursor protein (sAPPalpha). To determine whether a similar response occurs in a neuronal cell, we analyzed whether P2Y(2)R-mediated production of sAPPalpha occurs in rat primary cortical neurons (rPCNs). In rPCNs, P2Y(2)R mRNA and receptor activity were virtually absent in quiescent cells, whereas overnight treatment with the pro-inflammatory cytokine interleukin-1beta (IL-1beta) up-regulated both P2Y(2)R mRNA expression and receptor activity by four-fold. The up-regulation of the P2Y(2)R was abrogated by pre-incubation with Bay 11-7085, an IkappaB-alpha phosphorylation inhibitor, which suggests that P2Y(2)R mRNA transcript levels are regulated through nuclear factor-kappa-B (NFkappaB) signaling. Furthermore, the P2Y(2)R agonist Uridine-5'-triphosphate (UTP) enhanced the release of sAPPalpha in rPCNs treated with IL-1beta or transfected with P2Y(2)R cDNA. UTP-induced release of sAPPalpha from rPCNs was completely inhibited by pre-treatment of the cells with the metalloproteinase inhibitor TACE inhibitor (TAPI-2) or the phosphatidylinositol 3-kinase (PI3K) inhibitor LY294002, and was partially inhibited by the MAPK/extracellular signal-regulated kinase inhibitor U0126 and the protein kinase C inhibitor GF109203. These data suggest that P2Y(2)R-mediated release of sAPPalpha from cortical neurons is directly dependent on a disintegrin and metalloproteinase (ADAM) 10/17 and PI3K activity, whereas extracellular signal-regulated kinase 1/2 and PI3K activity may indirectly regulate APP processing. These results demonstrate that elevated levels of pro-inflammatory cytokines associated with neurodegenerative diseases, such as IL-1beta, can enhance non-amyloidogenic APP processing through up-regulation of the P2Y(2)R in neurons.


Figures

Figure 1
Figure 1. IL-1β upregulates P2Y2 receptor mRNA and function in rPCNs
(A) Rat primary cortical neurons (rPCNs) at DIV7 were treated with the indicated concentration of IL-1β for 24 h at 37 °C in serum-free DMEM and P2Y2R mRNA levels were detected by real-time PCR using GAPDH as a control. RT + or – indicates usage of reverse transcriptase in the PCR. (B) The effect on IL-1β-induced P2Y2R mRNA expression of a 30 min pretreatment of rPCNs with the indicated concentration of the IκB-α phosphorylation inhibitor Bay11 is shown. Real-time PCR data was expressed as a ratio of P2Y2R to GAPDH mRNA levels (n=6). Bay11 preincubation alone did not significantly change P2Y2R mRNA expression levels as compared to the untreated control (data not shown). * represents significant differences (p < 0.05), as compared to control conditions, and # represents significant differences (p < 0.05), as compared to rPCNs treated with 100 ng/ml IL-1β. (C) IL-1β-treated cells on coverslips were loaded with fura-2 and coverslips were positioned on the stage of an inverted epifluorescence microscope for measurement of [Ca2+]i, as described in the “Materials and Methods”. Then, rPCNs were incubated in PSS with UTP (100 µM), and the time-dependent increase in [Ca2+]i was determined. Results are expressed as the percentage of rPCNs responding to UTP. Data represent the means ± S.E.M. of results from at least three experiments where “n.s.” represents no significant differences (p > 0.05) and * represents significant differences (p < 0.05), as compared to rPCNs treated without IL-1β.
Figure 2
Figure 2. UTP stimulates phosphorylation of ERK1/2 in IL-1β-treated rPCNs
rPCNs were pretreated with the indicated concentration of IL-1β and/or TNF-α in serum-free DMEM for 24 h at 37 °C. Then, the medium was removed and cells were incubated for 10 min in serum-free DMEM with or without 100 µM UTP at 37 °C. (A, C) Cell lysates were subjected to Western blot analysis for phosphorylated ERK1/2 and total ERK1/2. (B, D) UTP-induced ERK1/2 phosphorylation was expressed as the ratio of phosphorylated ERK1/2 to total ERK1/2 after subtracting the basal level of ERK1/2 phosphorylation in the absence of UTP. The increase of ERK1/2 phosphorylation induced by IL-1β and/or TNF-α in rPCNs was expressed as a ratio of the UTP-stimulated rPCNs in the absence of cytokine pretreatment. Data represent the means ± S.E.M. of results from three experiments where “n.s.” represents no significant differences and * represents significant differences (p < 0.05), as compared to rPCNs treated without cytokines.
Figure 3
Figure 3. UTP induces sAPPα release in rPCNs pre-treated with IL-1β
rPCNs were pretreated with the indicated concentration of IL-1β in serum-free DMEM for 24 h at 37 °C. Then, the medium was removed and cells were incubated for 2 h at 37 °C in serum-free DMEM with or without 100 µM UTP or 1 µM PMA, a positive control. (A) The medium was collected and assayed by Western blot analysis for sAPPα release, whereas the actin level in cell lysate was determined as a control. (B) UTP- and PMA-induced sAPPα release in rPCNs with or without IL-1β pretreatment is expressed relative to the actin level in cell lysate, after subtracting basal sAPPα release in the absence of IL-1β and UTP treatment. Data represent the means ± S.E.M. of results from at least three experiments, where * represents significant differences (p < 0.05), as compared to UTP-treated rPCNs in the absence of IL-1β pretreatment.
Figure 4
Figure 4. P2Y2 receptor expression in rPCNs enhances α-secretase-mediated APP processing induced by UTP
On DIV5, rPCNs were transfected with human P2Y2R cDNA (− indicates untransfected controls). On DIV7, the neurons were incubated for 2 h in serum-free DMEM with or without 100 µM UTP or 1 µM PMA at 37 °C. (A) sAPPα release into the medium was determined by Western blot analysis. (B) sAPPα release is expressed relative to the actin level in cell lysate. Data represent the means ± S.E.M. of results from three independent experiments, where * represents significant differences (p < 0.05) between the indicated sample groups.
Figure 5
Figure 5. A metalloprotease inhibitor prevents UTP-induced sAPPα release from rPCNs
rPCNs were pretreated with 25 ng/ml IL-1β in serum-free DMEM for 24 h at 37 °C. The medium was replaced with fresh serum-free DMEM and the cells were incubated at 37 °C for 30 min with or without the metalloprotease inhibitor TAPI-2 (10 µM) followed by a 2 h incubation with or without UTP (100 µM). (A) The release of sAPPα into the medium was analyzed by Western blot analysis. (B) sAPPα release is expressed relative to the actin level in cell lysate. Data represent the means ± S.E.M. of results from six experiments, where * represents significant differences (p < 0.05) between the indicated sample groups analyzed by 2-way ANOVA followed by Bonferroni post-tests.
Figure 6
Figure 6. UTP-induced sAPPα release is partially dependent on PKC activation in IL-1β-treated rPCNs
rPCNs were pretreated with 25 ng/ml IL-1β in serum-free DMEM for 24 h at 37 °C. The medium was replaced with fresh serum-free DMEM and the cells were incubated at 37 °C for 30 min with or without GF109203 (10 µM) followed by a 2 h incubation with or without UTP (100 µM) or PMA (1 µM). (A) The release of sAPPα into the medium was analyzed by Western blot analysis. (B) sAPPα release is expressed relative to the actin level in cell lysate. Data represent the means ± S.E.M. of results from three experiments, where * represents significant differences (p < 0.05) between the indicated sample groups analyzed by 2-way ANOVA followed by Bonferroni post-tests.
Figure 7
Figure 7. Inhibition of PI3K prevents UTP-induced sAPPα release in IL-1β-treated rPCNs
rPCNs were pretreated with 25 ng/ml IL-1β in serum-free DMEM for 24 h at 37 °C. The medium was replaced with fresh serum-free DMEM and the cells were incubated at 37 °C for 30 min with or without LY294002 (1 µM) followed by a 2 h incubation with or without UTP (100 µM). (A) The release of sAPPα into the medium was analyzed by Western blot analysis. (B) sAPPα release is expressed relative to the actin level in cell lysate. Data represent the means ± S.E.M. of results from three experiments, where * represents significant differences (p < 0.05) between the indicated sample groups analyzed by 2-way ANOVA followed by Bonferroni post-tests.
Figure 8
Figure 8. UTP-stimulated sAPPα release in IL-1β-treated rPCNs is partially dependent on ERK1/2 activation
rPCNs were pretreated with 25 ng/ml IL-1β in serum-free DMEM for 24 h at 37 °C. The medium was replaced with fresh serum-free DMEM and the cells were incubated at 37 °C for 30 min with or without U0126 (1 µM) followed by a 2 h incubation with or without UTP (100 µM). (A) The release of sAPPα into the medium was analyzed by Western blot analysis. (B) sAPPα release is expressed relative to the actin level in cell lysate. Data represent the means ± S.E.M. of results from three experiments, where * represents significant differences (p < 0.05) between the indicated sample groups analyzed by 2-way ANOVA followed by Bonferroni post-tests.

Similar articles

Cited by

References

    1. Ahn JS, Camden JM, Schrader AM, Redman RS, Turner JT. Reversible regulation of P2Y2 nucleotide receptor expression in the duct-ligated rat submandibular gland. Am J Physiol Cell Physiol. 2000;279:C286–C294. - PubMed
    1. Allan SM, Rothwell NJ. Cytokines and acute neurodegeneration. Nat Rev Neurosci. 2001;2:734–744. Review. - PubMed
    1. Allinson TM, Parkin ET, Turner AJ, Hooper NM. ADAMs family members as amyloid precursor protein alpha-secretases. J Neurosci Res. 2003;74:342–352. - PubMed
    1. Anderson JP, Refolo LM, Wallace W, et al. Differential brain expression of the Alzheimer's amyloid precursor protein. EMBO J. 1989;8:3627–3632. - PMC - PubMed
    1. Black RA, Rauch CT, Kozlosky CJ, et al. A metalloproteinase disintegrin that releases tumor-necrosis factor-alpha from cells. Nature. 1997;385:729–733. - PubMed

Publication types

MeSH terms