. 2009 Apr 1;101(7):519-32.
doi: 10.1093/jnci/djp030. Epub 2009 Mar 24.

Fatty acid synthase: a metabolic enzyme and candidate oncogene in prostate cancer

Affiliations

Fatty acid synthase: a metabolic enzyme and candidate oncogene in prostate cancer

Toshiro Migita et al. J Natl Cancer Inst. .

Abstract

Background: Overexpression of the fatty acid synthase (FASN) gene has been implicated in prostate carcinogenesis. We sought to directly assess the oncogenic potential of FASN.

Methods: We used immortalized human prostate epithelial cells (iPrECs), androgen receptor-overexpressing iPrECs (AR-iPrEC), and human prostate adenocarcinoma LNCaP cells that stably overexpressed FASN for cell proliferation assays, soft agar assays, and tests of tumor formation in immunodeficient mice. Transgenic mice expressing FASN in the prostate were generated to assess the effects of FASN on prostate histology. Apoptosis was evaluated by Hoechst 33342 staining and by fluorescence-activated cell sorting in iPrEC-FASN cells treated with stimulators of the intrinsic and extrinsic pathways of apoptosis (ie, camptothecin and anti-Fas antibody, respectively) or with a small interfering RNA (siRNA) targeting FASN. FASN expression was compared with the apoptotic index assessed by the terminal deoxynucleotidyltransferase-mediated UTP end-labeling method in 745 human prostate cancer samples by using the least squares means procedure. All statistical tests were two-sided.

Results: Forced expression of FASN in iPrECs, AR-iPrECs, and LNCaP cells increased cell proliferation and soft agar growth. iPrECs that expressed both FASN and androgen receptor (AR) formed invasive adenocarcinomas in immunodeficient mice (12 of 14 mice injected formed tumors vs 0 of 14 mice injected with AR-iPrEC expressing empty vector (P < .001, Fisher exact test); however, iPrECs that expressed only FASN did not. Transgenic expression of FASN in mice resulted in prostate intraepithelial neoplasia, the incidence of which increased from 10% in 8- to 16-week-old mice to 44% in mice aged 7 months or more (P = .0028, Fisher exact test), but not in invasive tumors. In LNCaP cells, siRNA-mediated silencing of FASN resulted in apoptosis. FASN overexpression protected iPrECs from apoptosis induced by camptothecin but did not protect iPrECs from Fas receptor-induced apoptosis. In human prostate cancer specimens, FASN expression was inversely associated with the apoptotic rate (mean percentage of apoptotic cells, lowest vs highest quartile of FASN expression: 2.76 vs 1.34, difference = 1.41, 95% confidence interval = 0.45 to 2.39, Ptrend = .0046).

Conclusions: These observations suggest that FASN can act as a prostate cancer oncogene in the presence of AR and that FASN exerts its oncogenic effect by inhibiting the intrinsic pathway of apoptosis.


Figures
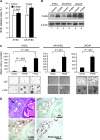
Figure 1
Figure 1
Effect of fatty acid synthase (FASN) overexpression on cell proliferation, growth in soft agar, and tumorigenesis in nude mice. A) 5-Bromodeoxyuridine (BrdU) incorporation assay. Immortalized human prostate epithelial cells (iPrECs), with or without the androgen receptor (AR) stably transfected with either the empty vector (EV) or FASN, were cultured for 2 days and 10 μM BrdU was added to the culture medium 1 hour before harvesting. The cells were analyzed by flow cytometry (10 000 cells per sample) to determine the percentage of cells that had incorporated BrdU. P values (Student t test) are two-sided. Mean percentage of BrdU-labeled cells in triplicate samples and 95% confidence intervals (error bars) are shown. B) Immunoblot analysis of FASN protein expression in iPrECs, AR-iPrECs, and LNCaP cells stably transfected with pBabe empty vector (lanes 1, 3, 5) and pBabe FASN (lanes 2, 4, 6). C) Anchorage-independent growth assay. The mean number of colonies 200 μm or greater in diameter that grew in soft agar from three independent experiments, each performed in triplicate, are plotted. AR-iPrECs and LNCaP cells are compared with the isogenic cell lines overexpressing FASN. iPrECs are also compared with iPrECs overexpressing H-rasVal12. Colonies (lower panels) are shown at ×20 and ×100 magnification. D) Hematoxylin-eosin–stained sections (upper left) and corresponding immunohistochemistry (brown staining, methyl green counterstaining) for AR, FASN, and SV40-large T antigen on orthotopic tumors derived from injection of AR-iPrEC-FASN in the anterior prostate of nude mice (scale bar  =  50 μm). Mouse prostate acinus is on the right (yellow arrow, upper left panel), whereas established tumor derived from AR-iPrEC-FASN human cells is in the stroma beneath the gland on the left (black arrow, upper left panel). For comparison, two-tailed Student t test was used.
Figure 2
Figure 2
Phenotype of prostate-specific fatty acid synthase (FASN)-transgenic (Tg) mice. A) Representative histological images of the anterior (AP), dorsolateral (DLP), and ventral (VP) prostatic lobes of a 6-month-old FASN-transgenic (Tg) mouse and a wild-type (WT) mouse (scale bar  =  100 μm). Epithelial hyperplasia is evident in the Tg mouse prostate (scale bar  =  100 μm) as shown by the filling of glandular lumen by hyperplastic epithelial cells. B) Prostatic hyperplasia leading to bladder outlet obstruction and bladder distension. C) Box plots showing the number of acini per largest diameter section from all of the prostate lobes in FASN-Tg and WT mice. Lower and higher whiskers indicate 10th and 90th percentile, respectively; lower and higher edges of box indicate 25th and 75th percentile, respectively; the inner line in the box indicates 50th percentile; and the dot in the box indicates the average of all data. For comparison of WT and Tg, a two-tailed Student t test was used. D) Age-related incidence of prostate intraepithelial neoplasia (PIN) in FASN-Tg mice. Incidence of PIN in FASN-Tg mice aged 1–3, 4–7, and 7 or more months. E) Example of the PIN phenotype in FASN-transgenic mice: hematoxylin–eosin (H&E) (arrow shows transition from normal to neoplastic epithelium) and immunohistochemical staining for FASN and androgen receptor (scale bar = 100 μm).
Figure 3
Figure 3
Effect of fatty acid synthase (FASN) overexpression on apoptosis. A) Apoptotic cell percentage (left bar graph) after Hoechst 33342 staining (right panels: strong white signals indicate apoptotic cells) of immortalized human prostate epithelial cells–empty vector (iPrEC-EV) and iPrEC-FASN cells treated with 50 nM camptothecin, a stimulator of mitochondria-mediated apoptosis. B) Percentage of apoptosis among LNCaP-EV and FASNCaP cells after treatment with 50 nM camptothecin as measured by Hoechst 33342 staining. C) Percentage of apoptosis in iPrEC-EV and iPrEC-FASN cells following treatment with 100–500 ng/mL of an antibody activating Fas, a proapoptotic tumor necrosis factor family cell surface receptor. Mean values of triplicate samples and 95% confidence intervals (CIs) from three independent experiments are shown; P values are from two-sided Student t tests. D) Mitochondrial membrane potential changes (ΔΨ) after treatment of iPrEC-EV and iPrEC-FASN cells with 50 nM camptothecin as assessed by rhodamine 123 (Rho 123) incorporation. A representative experiment is shown as dot plots (left) and histograms (right: 0 hours in purple, 18 hours in green). Viability was assessed by propidium iodide (PI) staining. E) Percentage of apoptosis (left bar graph) induced by treatment of LNCaP cells with 20 nM anti-FASN small interfering RNA (siRNA) at 24-hour intervals from 24 to 120 hours. Cleaved poly (ADP-ribose) polymerase expression as a measure of apoptosis was detected by immunoblot (middle panel, arrow). Reactive oxygen species (ROS) production in LNCaP cells treated with anti-FASN siRNA and palmitate (right panel). ROS production was determined by carboxy-H2DCFDA staining using flow cytometry.
Figure 4
Figure 4
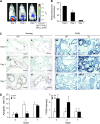
Bioluminescence imaging of fatty acid synthase (FASN)-transgenic (Tg) mice 0, 3, and 7 days after castration. To demonstrate the decrease in expression of the transgene as measured by luciferase activity in the prostate of Tg mice after castration, in vivo images were acquired at day 0, 3, and 7 after injection of d-luciferin (150 mg/kg body weight) via the tail vein. Pseudocolor images represent intensity of emitted light (red most intense and blue least intense). B) Signal intensity of luciferase activity in (A) as measured by photon counts. C) Terminal deoxynucleotidyltransferase-mediated UTP end-labeling (Apoptag) assay on ventral prostate tissue showing apoptotic cells by brown nuclear staining, counterstained with methyl green (wild type [WT] and Tg at 0, 3 and 7 days; first two columns on the left). FASN immunohistochemistry in sections of ventral prostate showing cytoplasmic FASN expression in blue counterstained with methyl green (WT and Tg at 0, 3 and 7 days; two columns on right). Ventral prostate sections from one representative WT and Tg mouse are shown. D) Percentage of apoptotic epithelial cells as compared with total cells (left) and FASN expression (right) in ventral prostate tissue by semiquantitative analysis of at least four high-power fields or 1000 cells per mouse (P value from two-tailed Student t test).
Figure 5
Figure 5
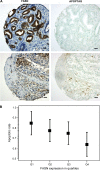
Association between apoptotic rate and fatty acid synthase (FASN) expression in human prostate cancer. A) Representative images of FASN immunoexpression levels (left panels) and apoptosis (Apoptag; right panels) in human prostate cancer tissue microarray with high (top left) or low (bottom left) FASN expression (scale bar  = 100 μm). B) Statistically significant inverse association between FASN expression in 745 prostate tumor samples (categorized by quartiles of FASN expression) and apoptotic rate (Ptrend  = .0046).

References

    1. Medes G, Thomas A, Weinhouse S. Metabolism of neoplastic tissue. IV. A study of lipid synthesis in neoplastic tissue slices in vitro. Cancer Res. 1953;13(1):27–29. - PubMed
    1. Kusakabe T, Maeda M, Hoshi N, et al. Fatty acid synthase is expressed mainly in adult hormone-sensitive cells or cells with high lipid metabolism and in proliferating fetal cells. J Histochem Cytochem. 2000;48(5):613–622. - PubMed
    1. Shurbaji MS, Kalbfleisch JH, Thurmond TS. Immunohistochemical detection of a fatty acid synthase (OA-519) as a predictor of progression of prostate cancer. Hum Pathol. 1996;27(9):917–921. - PubMed
    1. Alo’ PL, Visca P, Marci A, Mangoni A, Botti C, Di Tondo U. Expression of fatty acid synthase (FAS) as a predictor of recurrence in stage I breast carcinoma patients. Cancer. 1996;77(3):474–482. - PubMed
    1. Gansler TS, Hardman W, 3rd, Hunt DA, Schaffel S, Hennigar RA. Increased expression of fatty acid synthase (OA-519) in ovarian neoplasms predicts shorter survival. Hum Pathol. 1997;28(6):686–692. - PubMed

Publication types

MeSH terms