. 2009;4(3):e4853.
doi: 10.1371/journal.pone.0004853. Epub 2009 Mar 25.

A dynamic stochastic model of frequency-dependent stress fiber alignment induced by cyclic stretch

Affiliations

A dynamic stochastic model of frequency-dependent stress fiber alignment induced by cyclic stretch

Hui-Ju Hsu et al. PLoS One. 2009.

Abstract

Background: Actin stress fibers (SFs) are mechanosensitive structural elements that respond to forces to affect cell morphology, migration, signal transduction and cell function. Cells are internally stressed so that SFs are extended beyond their unloaded lengths, and SFs tend to self-adjust to an equilibrium level of extension. While there is much evidence that cells reorganize their SFs in response to matrix deformations, it is unclear how cells and their SFs determine their specific response to particular spatiotemporal changes in the matrix.

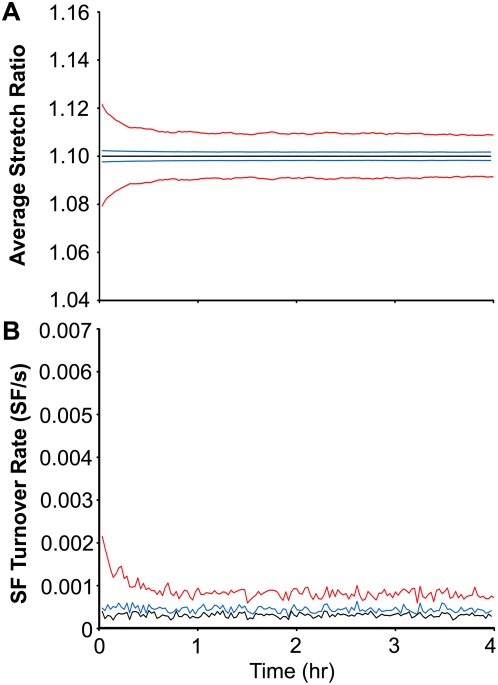
Methodology/principal findings: Bovine aortic endothelial cells were subjected to cyclic uniaxial stretch over a range of frequencies to quantify the rate and extent of stress fiber alignment. At a frequency of 1 Hz, SFs predominantly oriented perpendicular to stretch, while at 0.1 Hz the extent of SF alignment was markedly reduced and at 0.01 Hz there was no alignment at all. The results were interpreted using a simple kinematic model of SF networks in which the dynamic response depended on the rates of matrix stretching, SF turnover, and SF self-adjustment of extension. For these cells, the model predicted a threshold frequency of 0.01 Hz below which SFs no longer respond to matrix stretch, and a saturation frequency of 1 Hz above which no additional SF alignment would occur. The model also accurately described the dependence of SF alignment on matrix stretch magnitude.

Conclusions: The dynamic stochastic model was capable of describing SF reorganization in response to diverse temporal and spatial patterns of stretch. The model predicted that at high frequencies, SFs preferentially disassembled in the direction of stretch and achieved a new equilibrium by accumulating in the direction of lowest stretch. At low stretch frequencies, SFs self-adjusted to dissipate the effects of matrix stretch. Thus, SF turnover and self-adjustment are each important mechanisms that cells use to maintain mechanical homeostasis.


Conflict of interest statement

Competing Interests: The authors have declared that no competing interests exist.

Figures

Figure 1
Figure 1. The extent of stress fiber alignment depends on the frequency of cyclic uniaxial stretch.
Representative images are shown of sparsely seeded bovine aortic ECs that were subjected to 4 hr of 10% cyclic uniaxial stretch at frequencies of 1 (A), 0.1 (B), and 0.01 Hz (C), fixed, and stained for F-actin. The distributions of stress fiber orientations were determined using an intensity gradient algorithm and the results from multiple cells (n = 50 cells) are summarized as angular histograms (direction of stretch is horizontal with respect to the page). Simulations of SF reorganization in response to 4 hr of 10% cyclic uniaxial stretch at frequencies of 1, 0.1 and 0.01 Hz were performed using the optimized parameter values (k 0 = 3.0×10⁻⁴ s−1, k 1 = 1.8×10⁴ s−1, and τ = 0.5 s) and the angular histograms are shown for comparison to the experimental results. Bar, 50 µm.
Figure 2
Figure 2. Parameter estimation using the time courses of stress fiber alignment.
Circular variances of the stress fiber distributions were plotted over the period indicated to show the time courses of stress fiber alignment in response to 10% cyclic uniaxial stretch at frequencies of 1 (red circles), 0.1 (blue triangles), and 0.01 Hz (black squares). Results from simulations using the optimized parameter values (k 0 = 3.0×10⁻⁴ s−1, k 1 = 1.8×10⁴ s−1, and τ = 0.5 s) are illustrated for these conditions.
Figure 3
Figure 3. Sensitivity of the system behavior to the values of the model parameters.
A: Simulations of 10% cyclic uniaxial stretch at 1 Hz were performed over a range of values for k0 values of 10−4 (thick lines) and 10−5 s−1 (thin lines), and k1 values of 103 (red lines), 104 (blue lines), and 105 (black lines). Circular variance was plotted versus non-dimensionalized time tk 0 to illustrate that the rate of alignment scales with k 0, while the steady-state response depends on k 1. B: The effects stretch frequency on the steady-state average circular variance are shown for of τ values of 0.05 (triangles), 0.1 (squares), 0.5 (crossmarks), 1 (circles) and 5 s (diamonds), with k0 and k1 held constant at the optimized values. Plotting circular variance versus non-dimensionalized frequency illustrates that the values for the threshold and saturation frequencies scale with τ.
Figure 4
Figure 4. Predicted time evolutions of SF stretch and turnover rate in response to different frequencies of uniaxial stretch.
The maximum and minimum values of the population-averaged fiber stretch during a cycle (A) and the rate of SF turnover (B) are shown for simulations of 10% cyclic uniaxial stretch at frequencies of 1 (red), 0.1 (blue) and 0.01 Hz (black) using the optimized parameter values.
Figure 5
Figure 5. Predicted time evolutions of circular variance, SF stretch and fiber turnover rate in response to different frequencies of equibiaxial stretch.
The circular variance (A), the maximum and minimum values of the population-averaged fiber stretch during a cycle (B), and the rate of stress fiber turnover (C) are shown for simulations of 10% cyclic equibiaxial stretch at frequencies of 1 (red), 0.1 (blue) and 0.01 Hz (black) using the optimized parameter values.
Figure 6
Figure 6. Comparison between measurements and model predictions of effect of cyclic uniaxial stretch magnitude on SF alignment.
Simulations of 6 hr of cyclic uniaxial stretch at 1 Hz were performed over stretch magnitudes of 0 (static control) to 10% and the circular variances of the SF distributions were determined using the optimized parameter values. Circular variances of experimentally measured SF distributions (published in Kaunas et al. [17]) for cyclic uniaxial stretch at 1 Hz of non-confluent bovine aortic ECs transfected with Green Fluorescent Protein (circles) are shown for comparison.

References

    1. Burridge K, Fath K, Kelly T, Nuckolls G, Turner C. Focal adhesions: transmembrane junctions between the extracellular matrix and the cytoskeleton. Annu Rev Cell Biol. 1988;4:487–525. - PubMed
    1. Hotulainen P, Lappalainen P. Stress fibers are generated by two distinct actin assembly mechanisms in motile cells. J Cell Biol. 2006;173:383–394. - PMC - PubMed
    1. Deguchi S, Ohashi T, Sato M. Evaluation of tension in actin bundle of endothelial cells based on preexisting strain and tensile properties measurements. Mol Cell Biomech. 2005;2:125–133. - PubMed
    1. Lu L, Feng Y, Hucker WJ, Oswald SJ, Longmore GD, et al. Actin stress fiber pre-extension in human aortic endothelial cells. Cell Motil Cytoskeleton. 2008;65:281–294. - PubMed
    1. Lauffenburger DA, Horwitz AF. Cell migration: a physically integrated molecular process. Cell. 1996;84:359–369. - PubMed

Publication types