. 2009 Jun;61(6):1310-8.
doi: 10.1002/mrm.21877.

Spatial distribution and relationship of T1rho and T2 relaxation times in knee cartilage with osteoarthritis

Affiliations

Spatial distribution and relationship of T1rho and T2 relaxation times in knee cartilage with osteoarthritis

Xiaojuan Li et al. Magn Reson Med. 2009 Jun.

Abstract

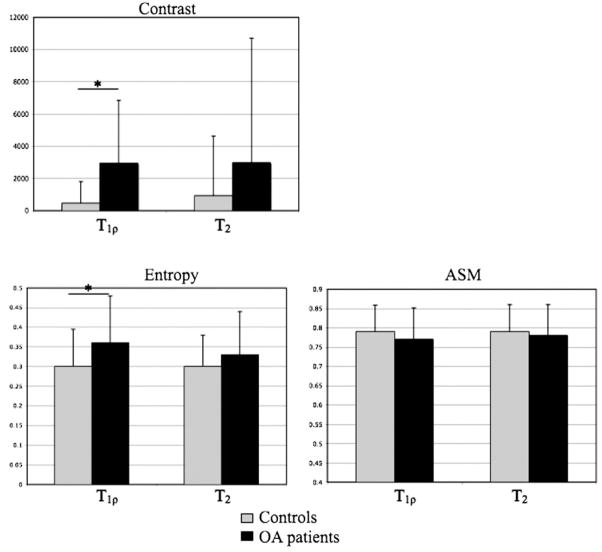
T(1rho) and T(2) relaxation time constants have been proposed to probe biochemical changes in osteoarthritic cartilage. This study aimed to evaluate the spatial correlation and distribution of T(1rho) and T(2) values in osteoarthritic cartilage. Ten patients with osteoarthritis (OA) and 10 controls were studied at 3T. The spatial correlation of T(1rho) and T(2) values was investigated using Z-scores. The spatial variation of T(1rho) and T(2) values in patellar cartilage was studied in different cartilage layers. The distribution of these relaxation time constants was measured using texture analysis parameters based on gray-level co-occurrence matrices (GLCM). The mean Z-scores for T(1rho) and T(2) values were significantly higher in OA patients vs. controls (P < 0.05). Regional correlation coefficients of T(1rho) and T(2) Z-scores showed a large range in both controls and OA patients (0.2-0.7). OA patients had significantly greater GLCM contrast and entropy of T(1rho) values than controls (P < 0.05). In summary, T(1rho) and T(2) values are not only increased but are also more heterogeneous in osteoarthritic cartilage. T(1rho) and T(2) values show different spatial distributions and may provide complementary information regarding cartilage degeneration in OA.


Figures

FIG. 1
FIG. 1
Definition of subcompartments of cartilage. trLF: lateral side of trochlea; trMF: medial side of trochlea; LFC: lateral femoral condyle; MFC: medial femoral condyle; LP: lateral side of patella; CP: central part of patella; MP: medial side of patella.
FIG. 2
FIG. 2
Line profile definition from bone/cartilage interface to cartilage surface in patellar cartilage. There are four lines defined in LP, three in CP, and four in MP, resulting in a total of 11 lines. There are 30 data points on each line after interpolation.
FIG. 3
FIG. 3
T (left) and T2 (right) maps of a healthy control (upper row) and an OA subject (lower row). Significantly elevated T and T2 values were observed in the patient. T and T2 showed different spatial elevations in the patient.
FIG. 4
FIG. 4
Correlation coefficients of T and T2 Z-scores in overall cartilage and in each subcompartment. The overall correlation co-efficient decreased in patients, but not significantly (P > 0.05). The correlation coefficient increased in pMFC and trMF (P < 0.05 in trMF) and decreased in patellar subcompartments.
FIG. 5
FIG. 5
T and T2 line profiles in patellar cartilage in controls (a) and OA patients (b). Both T and T2 values increased significantly from the bone/cartilage interface to the cartilage surface.
FIG. 6
FIG. 6
Texture parameters of T and T2 values in overall cartilage in controls and OA patients in 0° and 1 pixel offset. OA subjects had greater overall contrast and entropy, but lower overall ASM of cartilage T and T2 than controls at 0° and 90° in all pixel offsets. These differences were significant (P < 0.05) in the GLCM contrast, and entropy of cartilage T as indicated by * in the figure, while no significant difference was found in cartilage T2.
FIG. 7
FIG. 7
T ASM and entropy at 90° and 1 pixel offset in each compartment in controls and OA patients. The ASM was the lowest and the entropy was the highest in MFC compartments for both T and T2 values. The difference was significant in patients (P < 0.008, the significance level was adjusted for multicomparison) but not in controls. T2 ASM and entropy parameters showed similar patterns (data not shown).

References

    1. Brandt KD, Doherty M, Lohmander LS, editors. Osteoarthritis. New York: Oxford University Press; 1998.
    1. Link T, Stahl R, Woertler K. Cartilage imaging: motivation, techniques, current and future significance. Eur Radiol. 2007;17:1135–1146. - PubMed
    1. Gray M, Burstein D, Xia Y. Biochemical (and functional) imaging of articular cartilage. Seminars in musculoskeletal radiology. 2001;5:329–343. - PubMed
    1. Borthakur A, Mellon E, Niyogi S, Witschey W, Kneeland J, Reddy R. Sodium and T1rho MRI for molecular and diagnostic imaging of articular cartilage. NMR Biomed. 2006;19:781–821. - PMC - PubMed
    1. Dijkgraaf LC, de Bont LG, Boering G, Liem RS. The structure, biochemistry, and metabolism of osteoarthritic cartilage: a review of the literature. J Oral Maxillofac Surg. 1995;53:1182–1192. - PubMed

Publication types