. 2009 Jun;37(10):3215-29.
doi: 10.1093/nar/gkp159. Epub 2009 Mar 24.

New insights from old bones: DNA preservation and degradation in permafrost preserved mammoth remains

Affiliations

New insights from old bones: DNA preservation and degradation in permafrost preserved mammoth remains

Carsten Schwarz et al. Nucleic Acids Res. 2009 Jun.

Abstract

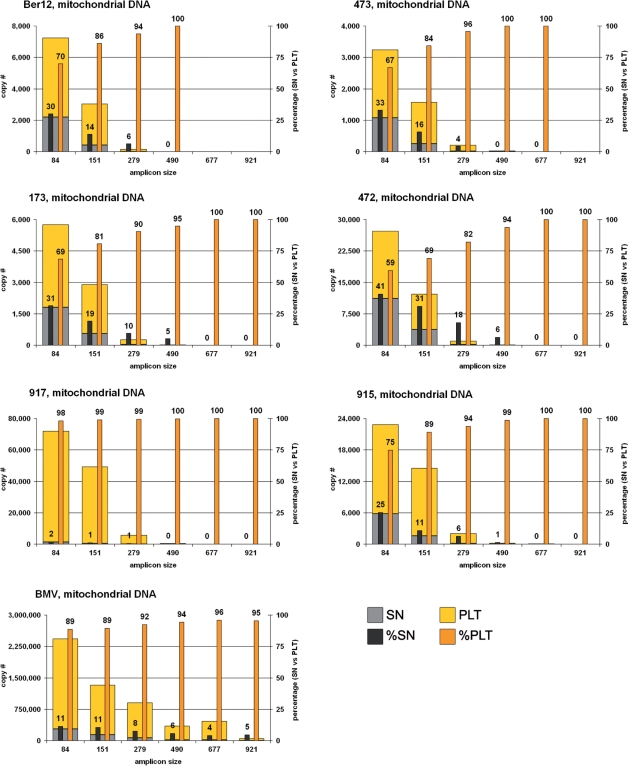
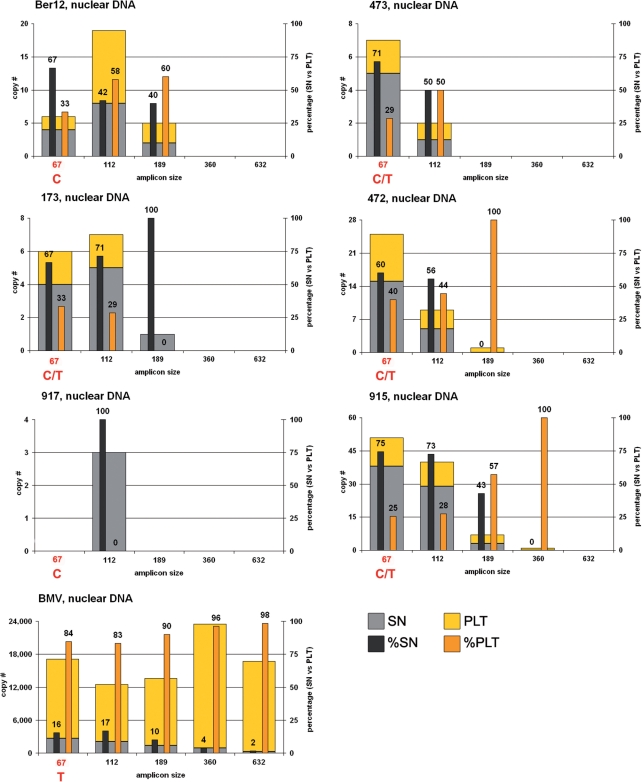
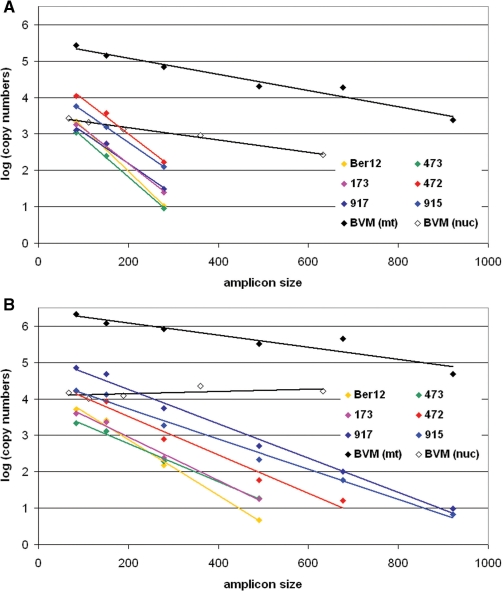
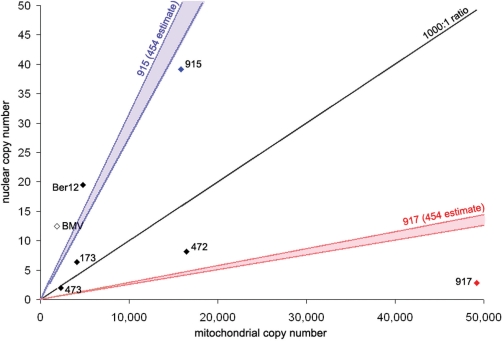
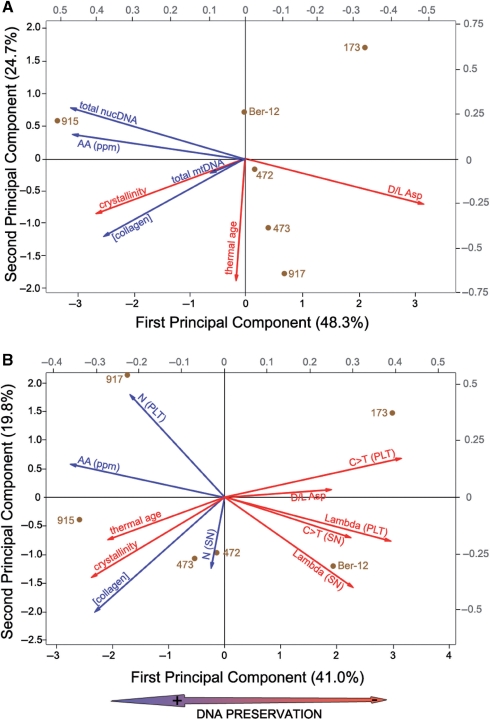
Despite being plagued by heavily degraded DNA in palaeontological remains, most studies addressing the state of DNA degradation have been limited to types of damage which do not pose a hindrance to Taq polymerase during PCR. Application of serial qPCR to the two fractions obtained during extraction (demineralization and protein digest) from six permafrost mammoth bones and one partially degraded modern elephant bone has enabled further insight into the changes which endogenous DNA is subjected to during diagenesis. We show here that both fractions exhibit individual qualities in terms of the prevailing type of DNA (i.e. mitochondrial versus nuclear DNA) as well as the extent of damage, and in addition observed a highly variable ratio of mitochondrial to nuclear DNA among the six mammoth samples. While there is evidence suggesting that mitochondrial DNA is better preserved than nuclear DNA in ancient permafrost samples, we find the initial DNA concentration in the bone tissue to be as relevant for the total accessible mitochondrial DNA as the extent of DNA degradation post-mortem. We also evaluate the general applicability of indirect measures of preservation such as amino-acid racemization, bone crystallinity index and thermal age to these exceptionally well-preserved samples.


Figures

Figure 1.
Figure 1.
Mitochondrial DNA yields of the six mammoths and the modern elephant extracts for the six amplicon sizes, in absolute copy numbers as given in Table S1 and relative contributions of the two fractions SN and PLT.
Figure 2.
Figure 2.
Nuclear DNA yields of the six mammoths and the modern elephant extracts for the five amplicon sizes, in absolute copy numbers as given in Table S1 and relative contributions of the two fractions SN and PLT. See text and Figure S2 for information concerning a variable position for the six mammoths within the primer binding site of the reverse primer of the 67 bp amplicon.
Figure 3.
Figure 3.
Linear regression for the modeling of non-bypassable damage, according to Deagle et al. for the six mammoths (only mitochondrial DNA) and the modern elephant (mitochondrial and nuclear DNA) extracts. x-axis is the amplicon size in bp, y-axis is the log(10) transformed copy number as in Table S1. The corresponding three regression parameters slope ( = lambda value, i.e. damage frequency), Y-intercept (N parameter, i.e. number of DNA copies of the length zero) and RSq are given in Table 2. (A) shows the regression for the SN fractions, (B) the regression for the PLT fractions.
Figure 4.
Figure 4.
Ratio of mitochondrial to nuclear DNA in the six mammoths and the modern elephant sample. x-axis is the copy number for mitochondrial, y-axis the copy number for nuclear DNA with the black diagonal depicting the line for a mt:nuc ratio of 1000:1. The blue and red areas in the diagram show the mt:nuc ratio range derived from 454 data (for samples 915 and 917 only). See text for details.
Figure 5.
Figure 5.
Results of principal component analyses performed on seven variables (A) and 11 variables (B) (see ‘Materials and Methods’ section). Loading vectors (right and top gray scale) and specimens score (bottom and left black scales) plots are shown together. Vectors of putative preservation antagonists are shown in red while preservation agonists are in blue. The double arrow at the bottom indicates the main signal extracted from the first principal component and associated with general (both quantitative and qualitative) DNA preservation.

References

    1. Debruyne R, Schwarz C, Poinar H. Comment on “Whole-Genome Shotgun Sequencing of Mitochondria from Ancient Hair Shafts”. Science. 2008;322:857. - PubMed
    1. Paabo S, Poinar H, Serre D, Jaenicke-Despres V, Hebler J, Rohland N, Kuch M, Krause J, Vigilant L, Hofreiter M. Genetic analyses from ancient DNA. Annu. Rev. Genet. 2004;38:645–679. - PubMed
    1. Shemesh A. Crystallinity and diagenesis of sedimentary apatites. Geochim. Cosmochim. Acta. 1990;54:2433–2438.
    1. Poinar HN, Hoss M, Bada JL, Paabo S. Amino acid racemization and the preservation of ancient DNA. Science. 1996;272:864–866. - PubMed
    1. Poinar HN, Stankiewicz BA. Protein preservation and DNA retrieval from ancient tissues. Proc. Natl Acad. Sci. USA. 1999;96:8426–8431. - PMC - PubMed

Publication types