. 2009 Jun;101(6):2924-33.
doi: 10.1152/jn.91313.2008. Epub 2009 Mar 25.

Visual modulation of auditory responses in the owl inferior colliculus

Affiliations

Visual modulation of auditory responses in the owl inferior colliculus

Joseph F Bergan et al. J Neurophysiol. 2009 Jun.

Abstract

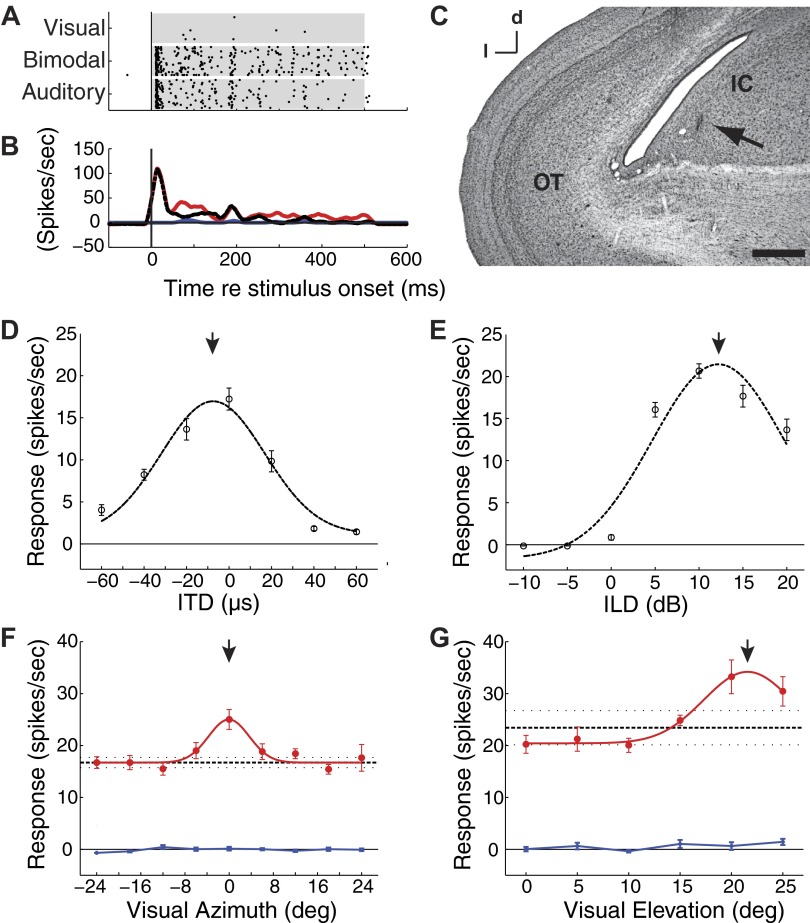
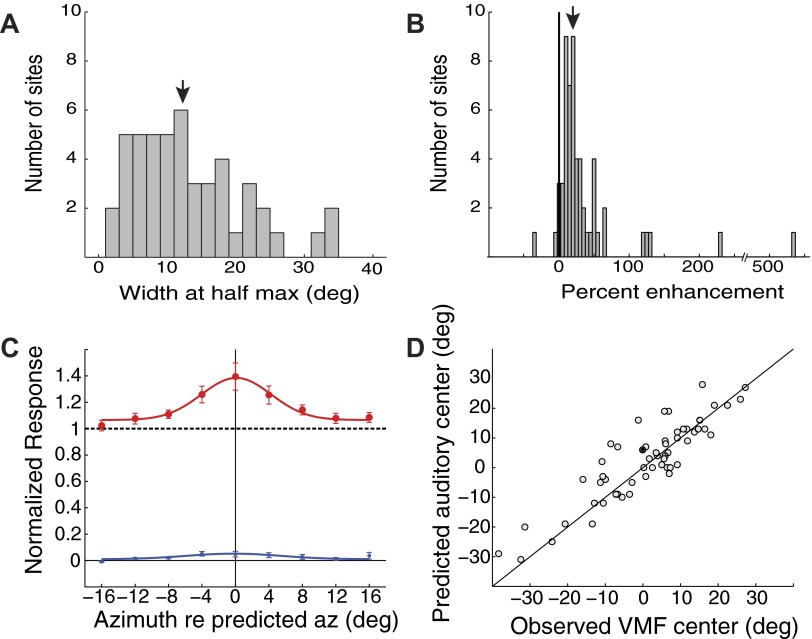
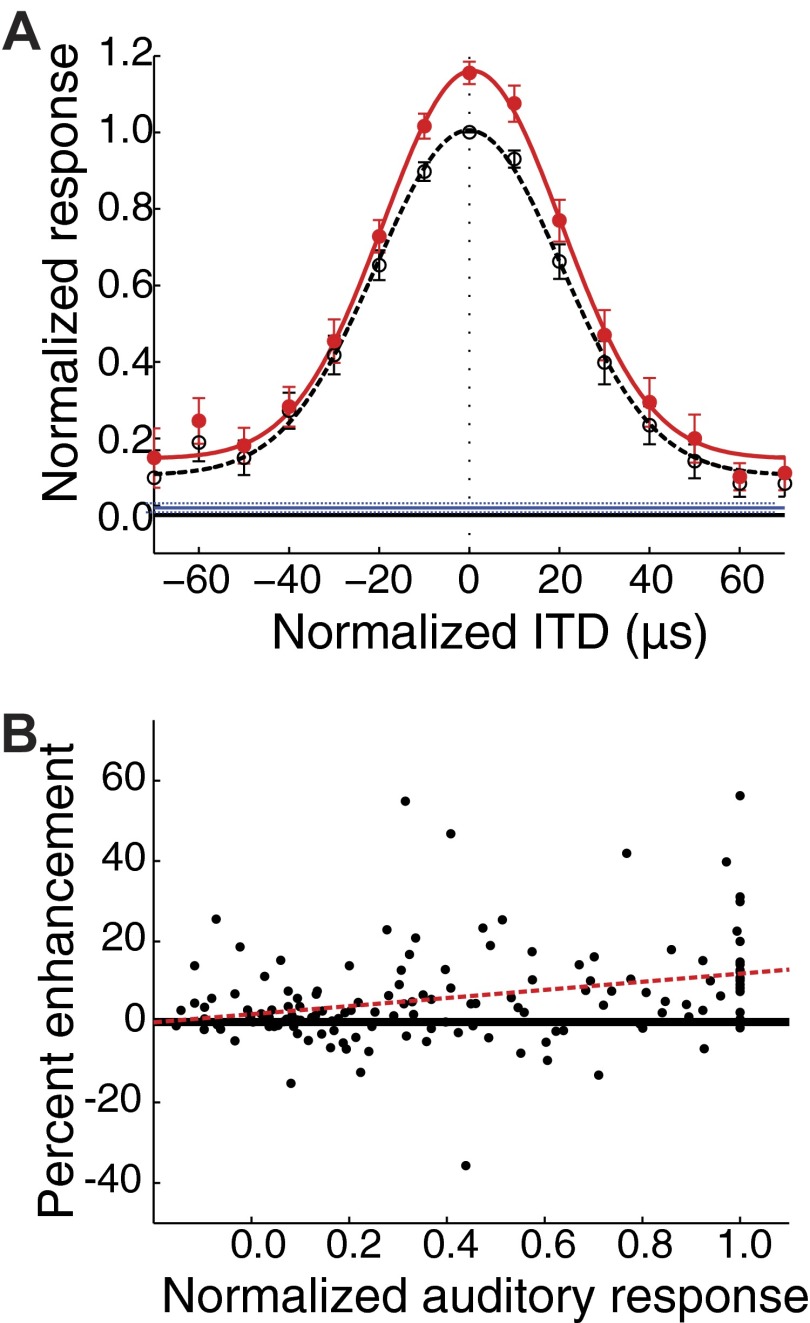
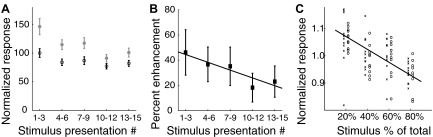
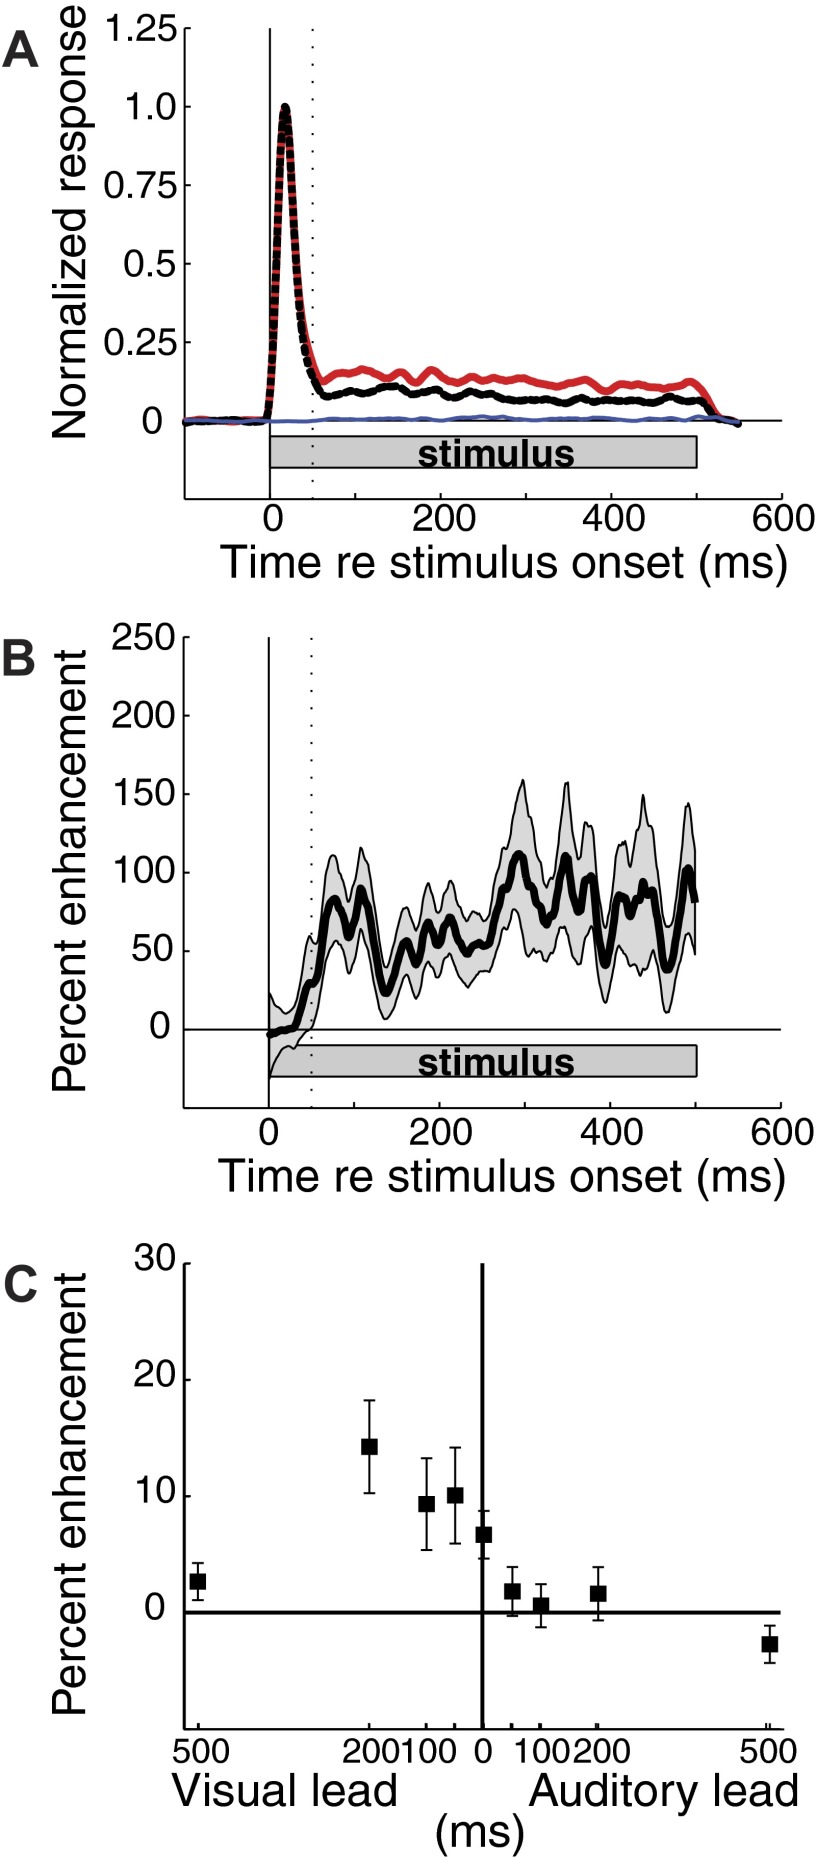
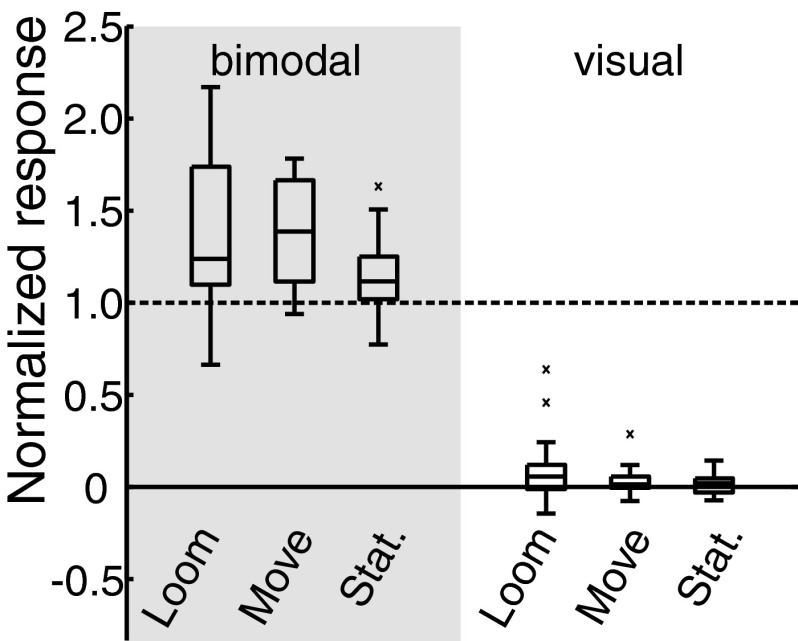
The barn owl's central auditory system creates a map of auditory space in the external nucleus of the inferior colliculus (ICX). Although the crucial role visual experience plays in the formation and maintenance of this auditory space map is well established, the mechanism by which vision influences ICX responses remains unclear. Surprisingly, previous experiments have found that in the absence of extensive pharmacological manipulation, visual stimuli do not drive neural responses in the ICX. Here we investigated the influence of dynamic visual stimuli on auditory responses in the ICX. We show that a salient visual stimulus, when coincident with an auditory stimulus, can modulate auditory responses in the ICX even though the same visual stimulus may elicit no neural responses when presented alone. For each ICX neuron, the most effective auditory and visual stimuli were located in the same region of space. In addition, the magnitude of the visual modulation of auditory responses was dependent on the context of the stimulus presentation with novel visual stimuli eliciting consistently larger response modulations than frequently presented visual stimuli. Thus the visual modulation of ICX responses is dependent on the characteristics of the visual stimulus as well as on the spatial and temporal correspondence of the auditory and visual stimuli. These results demonstrate moment-to-moment visual enhancements of auditory responsiveness that, in the short-term, increase auditory responses to salient bimodal stimuli and in the long-term could serve to instruct the adaptive auditory plasticity necessary to maintain accurate auditory orienting behavior.


Figures

FIG. 1.
FIG. 1.
Visual enhancement of auditory responses of a single inferior colliculus (ICX) unit. A: raster plots of responses to optimized visual-alone, bimodal, and auditory-alone stimuli. Each point represents the time of a spike to 20 repetitions of each stimulus. Auditory, visual, and bimodal stimuli were presented in a randomly interleaved fashion. Shaded regions indicate the period of stimulus presentation. B: responses, from A, were binned at 1 ms and smoothed with a 15-ms running average (visual, blue; auditory, black-dashed; bimodal, red). C: an electrolytic lesion (arrow) indicates the recording site centered in the ICX (OT, optic tectum; IC, inferior colliculus). Scale bar = 500 μm; d, dorsal; l, lateral. D and E: average responses to interaural time difference (ITD, D) or interaural level difference (ILD, E) during a 500-ms broadband auditory stimulus. Dashed black lines indicate the normal curve that minimized the least squares estimate of the measured data. Error bars represent bootstrap SE. Responses at this site were maximum to an ITD value of -7.5 μs [left ear leading; 95% confidence interval (CI): -10.5 to -4.5; arrow] and an ILD value of 12.2 (right ear greater; 95% CI: 11.5 to 12.9; arrow). F and G: response profiles to visual-alone stimuli (blue), auditory-alone stimuli (black), and bimodal stimuli (red; filled circles) were measured for a range of visual stimulus azimuths (F) and elevations (G). The response to the auditory-alone stimulus is plotted as a horizontal black line (dashed horizontal lines indicate the mean and bootstrap SE) extended across the plot as a reference for bimodal responses. Error bars represent the bootstrap SE. The response enhancements were significant for both azimuth and elevation (F, Paz < 0.0001; G, Pel = 0.035; bootstrap test with Bonferroni correction). Downward arrows: visual modulation field (VMF) center.
FIG. 2.
FIG. 2.
Summary of VMF sizes, strengths, and alignments with auditory receptive fields. VMFs were measured by varying the location of a visual stimulus while keeping an optimized auditory stimulus constant. A: VMF widths in azimuth, measured at 50% of the maximum enhancement over auditory-alone responses (downward arrow: median width). B: VMF strengths, measured relative to the maximum auditory-alone responses (downward arrow: median magnitude). C: average VMF (red; filled circles) and visual-alone (blue; asterisks) profiles, calculated by aligning data on the measured VMF center at each site. Response magnitudes were normalized to the auditory-alone response (dashed black). Error bars represent the bootstrap SE. D: the predicted auditory receptive field center, based on tuning to ITD and ILD (see methods), plotted as a function of the observed azimuth of the VMF center (R2 = 0.79; P < 0.00001).
FIG. 3.
FIG. 3.
Auditory-alone, visual-alone, and bimodal responses measured by varying the location of the auditory stimulus while keeping the visual stimulus constant at the VMF center. A: average auditory-alone (black; dashed line; open circles) and bimodal (red; solid line; filled circles) response profiles plotted with the corresponding best-fit normal curves. For each site, responses were aligned on the best ITD value and normalized to the peak auditory-alone response. The visual-alone response is extended across the plot for comparison (blue; dashed lines indicate the bootstrap s.e.m.). Bimodal stimuli, with the visual stimulus centered in the VMF, enhanced responses to an auditory stimulus for a wide range of auditory stimulus locations. The difference between bimodal and auditory-alone responses was highly significant (P < 0.00001; bootstrap test with Holm-Bonferroni correction), with significant differences in individual ITD values as far out as 70 μs (P < 0.05; bootstrap test with Holm-Bonferroni correction). Error bars represent the bootstrap SE. B: the percent enhancement of responses as a function of auditory response, all values normalized to the maximum auditory response. Percent enhancement was calculated as: (bimodal response − auditory response)/auditory response. As indicated by the best-fit line (dashed red), response enhancement increased slightly as the strength of the auditory response increased (slope: 0.10 CI = 0.05–0.15; R2 = 0.09; P = 0.0002).
FIG. 4.
FIG. 4.
Rare visual stimuli enhanced auditory responses more than frequently presented visual stimuli. A: average responses to repeated presentation of auditory-alone (black; open circles) and looming bimodal (grey; filled circles) stimuli. Responses represent averages across three successive stimulus presentations. Responses to both auditory-alone (R2 = 0.21; P = 0.01; F = 6.64; regression of auditory response on stimulus presentation number) and bimodal stimuli (R2 = 0.39; P = 0.0001; F = 16.61; regression of bimodal response on stimulus presentation number) declined with successive stimulus presentations. Error bars represent the bootstrap SE. B: the average bimodal response enhancement [(bimodal response − auditory response)/auditory response] induced by looming visual stimuli plotted as a function of the order of stimulus presentation. The percent enhancement of auditory responses decreased with repeated presentations of the looming stimulus [slope = −2.2; 95% CI = −4.0 to −0.5; R2 = 0.38; P = 0.01; F = 7.93; regression of response enhancement on stimulus presentation number]. Error bars represent the bootstrap SE. C: rare stimuli within a stimulus block evoked stronger responses. Two identical visual stimuli moved across identical portions of the visual field but in opposite directions (1 to the left and the other to the right). Both of these visual stimuli were synchronized with an auditory stimulus at the best ITD and best ILD for the site. These 2 bimodal stimuli were randomly interleaved in 4 blocks of trials in which the ratios of leftward to rightward visual stimuli were: 20/80, 40/60, 60/40, or 80/20. Responses to leftward (×) and rightward (open circles) stimuli are plotted side by side for each case in which the stimulus was presented with a specific ratio. Stronger responses were observed with less frequently presented stimuli (R2 = 0.26; F = 29.5; P < 0.00001; regression of response on stimulus probability). Error bars represent the bootstrap SE.
FIG. 5.
FIG. 5.
Time course of response enhancement. At each ICX site, responses to auditory-alone, visual-alone, and bimodal stimuli were binned at 1 ms and smoothed with a 15-ms running average. A: visual-alone (blue) and bimodal (red) data represent responses to stimuli presented at the azimuth that most closely matched the predicted auditory receptive field center for each site. Data were averaged across sites and normalized to the peak auditory (dashed black) response. B: time course of response enhancement: (bimodal response − auditory-alone response)/auditory-alone response. In each panel, the stimulus duration is indicated by the grey rectangle; the vertical dotted line is at 50-ms post-stimulus onset. Shaded grey region indicates the bootstrap SE. C: effect of varying the relative onset time of visual vs. auditory stimuli on response enhancement. In this experiment, 200-ms auditory and visual stimuli were presented (in contrast to the 500-ms stimuli used in other tests), and the response during the auditory stimulus is plotted. Error bars indicate the bootstrap SE.
FIG. 6.
FIG. 6.
Comparison of ICX responses to bimodal and visual-alone stimulation. Three kinds of visual stimuli (looming, moving, and stationary; see methods) were presented with or without a synchronous auditory stimulus. The 1st 50 ms of the stimulus presentation were excluded from analysis because no visual modulation occurred during this time window. Response profiles were normalized to the auditory-alone response (dashed black line) at each site. Each boxplot indicates the smallest value, lower quartile, median, upper quartile, and largest value (outliers are indicated ×). Average bimodal responses were 140.5 ± 10.3% with a looming visual stimulus, 139.7 ± 6.5% with a moving visual stimulus, and 113.9 ± 5.1% with a stationary visual stimuli as compared to the auditory-alone response (Ploom < 0.0001, Pmove < 0.0001, Pstat = 0.0025; bootstrap test with Bonferroni correction). Across all sites, only looming visual-alone stimuli induced a detectable response above baseline (9.2 ± 4.4%) relative to auditory-alone responses (P = 0.006; bootstrap test with Bonferroni correction). Error bars indicate the bootstrap SE.

References

    1. Bergan JF, Ro P, Ro D, Knudsen EI. Hunting increases adaptive auditory map plasticity in adult barn owls. J Neurosci 25: 9816–9820, 2005. - PMC - PubMed
    1. Bichot NP, Schall JD. Effects of similarity and history on neural mechanisms of visual selection. Nat Neurosci 2: 549–554, 1999. - PubMed
    1. Bizley JK, Nodal FR, Bajo VM, Nelken I, King AJ. Physiological and anatomical evidence for multisensory interactions in auditory cortex. Cereb Cortex 17: 2172–2189, 2007. - PMC - PubMed
    1. Brainard DH The Psychophysics Toolbox. Spat Vis 10: 433–436, 1997. - PubMed
    1. Brainard MS, Knudsen EI. Experience-dependent plasticity in the inferior colliculus: a site for visual calibration of the neural representation of auditory space in the barn owl. J Neurosci 13: 4589–4608, 1993. - PMC - PubMed

Publication types

MeSH terms

LinkOut - more resources