. 2009 Jun;101(6):2995-3011.
doi: 10.1152/jn.90740.2008. Epub 2009 Mar 25.

Excitatory actions of ventral root stimulation during network activity generated by the disinhibited neonatal mouse spinal cord

Affiliations

Excitatory actions of ventral root stimulation during network activity generated by the disinhibited neonatal mouse spinal cord

Agnes Bonnot et al. J Neurophysiol. 2009 Jun.

Abstract

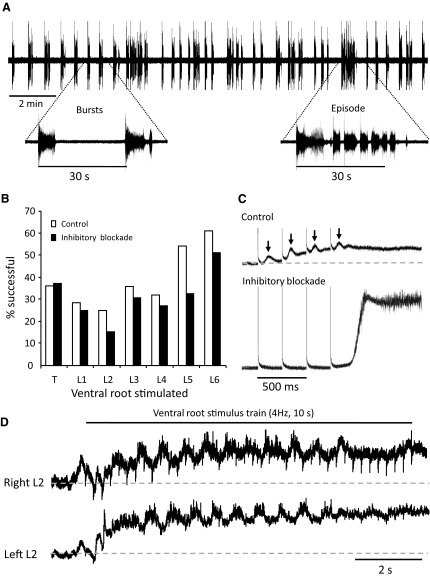
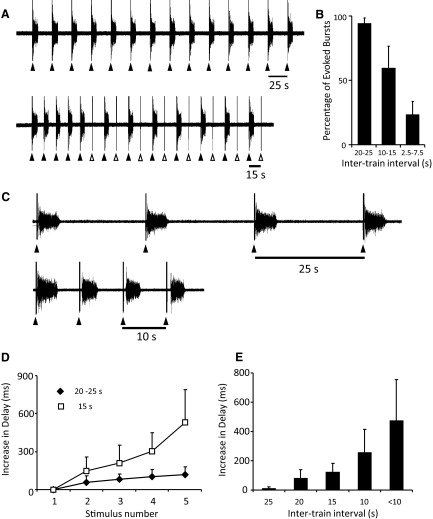
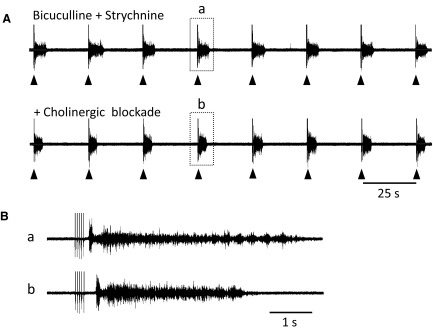
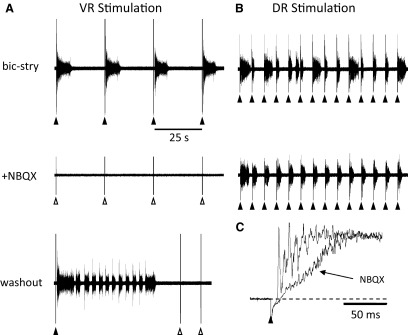
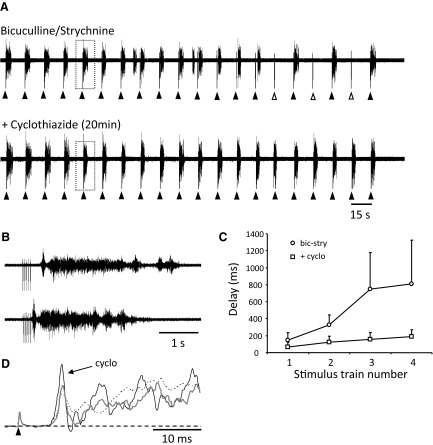
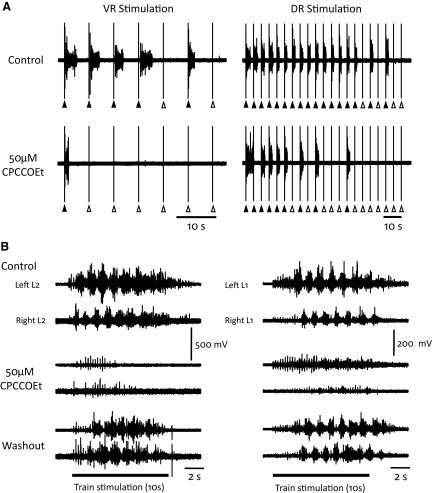
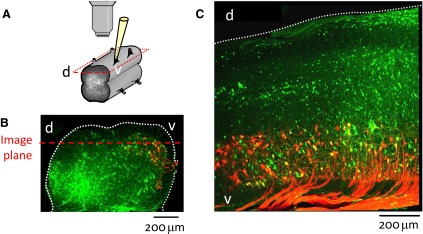
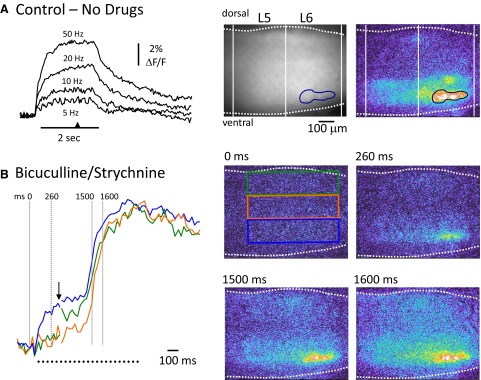
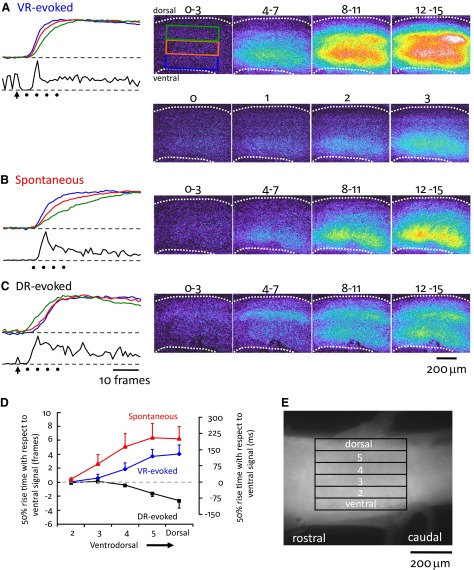
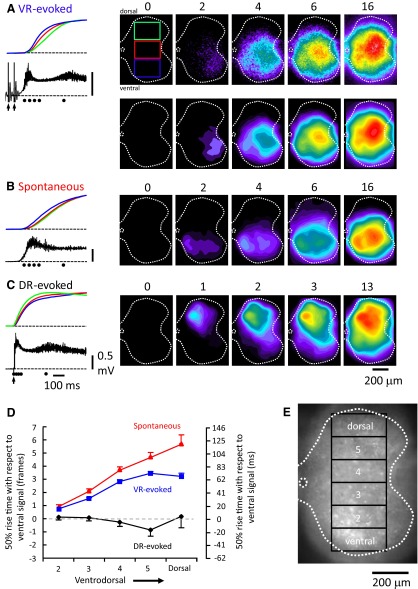
To further understand the excitatory effects of motoneurons on spinal network function, we investigated the entrainment of disinhibited rhythms by ventral root (VR) stimulation in the neonatal mouse spinal cord. A brief train of stimuli applied to a VR triggered bursting reliably in 31/32 experiments. The same roots that entrained disinhibited bursting could also produce locomotor-like activity with a similar probability when the network was not disinhibited. The ability of VR stimulation to entrain the rhythm persisted in nicotinic and muscarinic cholinergic antagonists but was blocked by the AMPAR antagonist NBQX. Bath application of the type I mGluR1 receptor antagonist CPCCOEt reduced the ability of both dorsal root and VR stimulation to entrain the disinhibited rhythm and abolished the ability of either type of stimulation to evoke locomotor-like activity. Calcium imaging through the lateral aspect of the cord revealed that VR stimulation and spontaneously occurring bursts were accompanied by a wave of activity that originated ventrally and propagated dorsally. Imaging the cut transverse face of L(5) revealed that the earliest VR-evoked optical activity began ventrolaterally. The optical activity accompanying spontaneous bursts could originate ventrolaterally, ventromedially, or throughout the mediolateral extent of the ventral horn or very occasionally dorsally. Collectively, our data indicate that VR stimulation can entrain disinhibited spinal network activity and trigger locomotor-like activity through a mechanism dependent on activation of both ionotropic and metabotropic glutamate receptors. The effects of entrainment appear to be mediated by a ventrolaterally located network that is also active during spontaneously occurring bursts.


Figures

FIG. 1.
FIG. 1.
A: spontaneous bursting recorded from the right L5 ventral root 25 min after application of bicuculline (20 μM) and strychnine (1 μM). B: comparison of the percentage of roots from thoracic (T11–13) to L6 in which stimulation evoked locomotor-like bursting in control (29 experiments) vs. the percentage of roots in which stimulation evoked bursting in the presence of bicuculline and strychnine (31 experiments). C: averages of 4 DC recordings of the left L6 ventral root during 4-Hz trains applied to the left L5 ventral root (4 stimuli, 50 μA) in control (top) and under bicuculline (20 μM) and strychnine (1 μM; bottom). Under control conditions, each stimulus of the train evoked a slow long-latency potential (↓) superimposed on a tonic depolarization. In the presence of bicuculline and strychnine these potentials were not observed and the stimulus train evoked a burst after a delay. D: alternating locomotor-like activity recorded from the left and right L2 ventral roots and induced by a 4-Hz train, 50 μA applied for 10 s to the left L5 ventral root (same experiment as in C).
FIG. 2.
FIG. 2.
A: in the presence of bicuculline (20 μM) and strychnine (1 μM), bursting on the right L5 ventral root was entrained by stimulation of the adjacent L6 ventral root (5 pulses, 4 Hz, 50 μA) every 25 and 15 s. B: graph showing the percentage of stimulus trains evoking a burst at different frequencies (8 trains at each frequency P < 0.0005, 6 experiments). C: the delay between the stimulus train and the onset of a burst increased with successive stimuli and with shorter intertrain intervals. The 1st 4 evoked bursts in a sequence where the intertrain interval was either 25 (top) or 10 s (bottom). In this experiment, the recording was from the left L5 ventral root and the adjacent L6 root was stimulated (bicuculline 20 μM, strychnine 1 μM). D: plot of the average increase in the delay (ms) between the last stimulus of the train and the onset of the evoked bursts at 2 different frequencies for 5 consecutive bursts (5 experiments). E: plot of the average increase in delay per stimulus for 5 intertrain intervals (4 experiments for 25, 20, and 15 s, 3 experiments for 10 s and <10 s).
FIG. 3.
FIG. 3.
Entrainment of bursting persists in the presence of cholinergic antagonists. A: disinhibited bursting recorded from the left L6 ventral root is entrained by stimulation (5 pulses, 4 Hz, 50 μA) of the adjacent L5 ventral root every 25 s (bicuculline 50 μM; strychnine 5 μM). When cholinergic blockers were added to the bath, the entrainment by ventral root stimulation persisted. B: the 2 bursts indicated by the boxed areas in A (a and b) displayed at an expanded time scale.
FIG. 4.
FIG. 4.
Entrainment of bursting by ventral but not dorsal root stimulation is abolished by the AMPA receptor antagonist NBQX. A, top traces: 4 bursts recorded on the right L5 ventral root entrained by stimulation (5 pulses, 4 Hz, 60 μA) of the left L3 ventral root in the presence of bicuculline (20 μM) and strychnine (1 μM). The same trains of stimuli do not evoke bursting 3 min after application of 5 μM NBQX. After washout of the NBQX, bursts were occasionally triggered by ventral root (VR) stimulation. B: entrainment of bursting obtained in the same experiment by stimulation of the right L5 dorsal root (single stimulus, 30 μA) every 5 s. Dorsal root entrainment is maintained 6 min after NBQX application at a time when the ventral root entrainment has been abolished. C: in the presence of NBQX, all short-latency L5 dorsal root-evoked reflexes recorded in the L5 ventral root are abolished.
FIG. 5.
FIG. 5.
Entrainment of bursting is more reliable in the presence of the AMPA desensitization blocker cyclothiazide. A, top trace: bursts recorded from the right L5 ventral root in response to stimulus trains (5 pulses, 4 Hz, 25 μA, 200 μs) applied to the right L6 ventral root every 15 s in the presence of bicuculline (40 μM) and strychnine (4 μM). Note that some of the stimuli do not evoke a burst (open triangles). Bottom traces: recordings from the same root in response to the same sequence of stimuli 20 min after application of cyclothiazide (25 μM) showing that each train now evokes a burst. B: 2 bursts indicated by the boxed areas in A (a and b) shown at an expanded time scale to illustrate the reduced latency in the presence of cyclothiazide. C: graph plotting the average delays between the last stimulus and the onset of the VR-evoked burst for 5 consecutive VR trains applied at a 15-s interval (4 experiments). D: records showing the increased amplitude of the monosynaptic reflex recorded from the L5 ventral root in response to stimulation of the L5 dorsal root in the presence of cyclothiazide (black trace, cyclo) compared with its amplitude in the presence of bicuculline and strychnine alone (gray trace), and after washout of the cyclothiazide (dotted trace).
FIG. 6.
FIG. 6.
Entrainment of bursting is less reliable and locomotor-like activity is abolished in the presence of the mGluR1 antagonist 7-(hydroxyimino)cyclopropa[β]chromen-1α-carboxylate ethyl ester (CPCCOEt) A: entrainment of bursting in bicuculline and strychnine is less effective in the presence of the mGluR1 antagonist CPCCOEt (50 μM) for both ventral (left, VR stimulation) and dorsal (right, DR stimulation) stimuli. The interval between the VR stimulus trains (5 stim at 20 Hz; only the last stimulus of the train is shown on the trace) was 7.5 s and between the DR stimuli was 5 s. The DR stimulus intensity was set just below the stimulus intensity to produce 100% entrainment, and resulted in some failures. B: CPCCOEt (50 μM) reversibly abolished locomotor-like activity evoked either by a train of ventral root stimuli (left, VR stimulation) or dorsal root stimuli (right, DR stimulation). Both stimulus trains were 4 Hz for 10 s and are shown by the bar (train stimulation) under the traces.
FIG. 7.
FIG. 7.
Arrangement for viewing electroporated cords through the lateral side. A: schematic illustrating relationship between objective and cord. B and C: confocal micrographs of a transverse section of the L5 segment (B) and a parasagittal section ∼200 μm from the lateral surface of the L5 and L6 segments (C) from cords that had been electroporated with the calcium green salt and in which motoneurons were retrogradely labeled with Texas Red Dextran. The dotted red line in B shows the approximate plane of view in which motoneurons and laterally situated interneurons were visualized. Confocal images are stacks of ∼20 slices taken at 2 μm intervals using a ×20 objective. d-dorsal; v-ventral.
FIG. 8.
FIG. 8.
Comparison of the location of antidromically activated motoneurons and ventrally derived optical signals at the onset of a burst triggered by ventral root stimulation. A: antidromic stimulation of motoneurons in the absence of any drugs. Left: the fluorescence transients generated from motoneurons (over the area indicated by the blue region of interest shown in the upper 2 video-micrographs to the right) in response to antidromic stimulation of the right L5 and L6 ventral roots at several frequencies (indicated above traces). The 1st micrograph in A, shows the right L5–L6 area of the electroporated cord viewed from the lateral side. Rightmost: a difference image (8 frame average) of the fluorescence change in response to 50-Hz stimulation taken at the time indicated by the arrowhead on the time calibration bar in A. B: a train of stimuli (100 pulses at 50 Hz) applied to the right L5 and L6 ventral roots (2 s stimulation) in the presence of bicuculline (40 μM) and strychnine (4 μM) initially antidromically activated motoneurons and then triggered a burst. Left: the normalized fluorescence transients recorded from the 3 rectangular regions shown in the videomicrograph at 0 ms. Note that the traces are interrupted at the arrow to show the timing of the activity during the burst in more detail. After the initial antidromic response, a burst is triggered with activity in the ventral region (blue rectangle) leading the activity in the intermediate and dorsal regions. The timing of the last frame in each of the videomicrograph 4 frame averages is shown in milliseconds above the images and over the dotted lines on the fluorescence transients. Each difference image has been subtracted from the prestimulus control and median filtered.
FIG. 9.
FIG. 9.
Visualization of the spread of optical activity during evoked and spontaneous bursts viewed through the lateral aspect of the cord. A—C: imaging of an electroporated cord during VR-evoked (A), spontaneous (B), and DR-evoked (C) bursting in the presence of bicuculline (40 μM) and strychnine (4 μM). Each image is a median filtered, 4 frame average of the difference image obtained by subtracting the active frames from a preburst average. The time over the images indicates the frames used in the average. The panels to the left of each series of video-micrographs show the optical signals normalized to the peak activity from the ventral (blue), medial (orange), and dorsal (green) areas of the cord (T13–L1 area, left side) over a 55-frame period (30-Hz acquisition) aligned with the VR activity (black traces under optical signals; left L6 ventral root in B and C, and the left L3 in A). The time of the last stimulus in the ventral root train applied to the left T13 ventral root (5 pulses, 20 Hz, 55 μA) is shown by the arrow beneath the electrical trace. The arrow in C indicates the time of a single stimulus applied to the left T13 and L1 dorsal roots (30 μA). The dots under the electrical traces indicate the timing of the last frame of the 4 frame average for each of the 4 sequential video-micrograph averages shown on the right. The frames shown below the images in A and marked 0–3 show individual, sequential frames at the onset of the earliest optical activity in response to a ventral root train of stimuli. Each frame has been averaged from video sequences obtained in 4 different ventral-root evoked bursts and shows the ventral origin of the optical activity. D: graph summarizing the timing (in frames and in ms) of the fluorescent transients recorded from the regions of interest shown in E. The 50% rise time of the optical transient is expressed with respect to the 50% rise time of the most ventral transient. Data are averaged from 5 experiments and expressed as means ± SE.
FIG. 10.
FIG. 10.
Visualization of the spread of optical activity during evoked and spontaneous bursts imaged from the cut transverse face of the rostral L5 segment. A–C: imaging of the fluo-3 AM labeled cord during VR-evoked (A), spontaneous (B), and DR-evoked (C) bursting in the presence of bicuculline (20 μM) and strychnine (5 μM). Each image is a difference image obtained by subtracting a preburst image (average of 5 frames) from the active frames. The top set of images was median filtered and the remaining were rank filtered. The numbers above the images indicate the frames (from stream acquisition performed at 1-ms interframe interval, 20 ms frame duration) selected for illustration. The panels to the left show the normalized optical signals from the ventral (blue), medial (red), and dorsal (green) areas of the cord (segment L5, right side) over a 33 frame period aligned with the electrical activity recorded from the ventral root (L5 in B and C and L4 in A). The last 2 stimuli of the train applied to the L5 ventral root (5 pulses, 20 Hz, 200 μs, 80 μA) are shown by the arrows under the electrical trace recorded from L4 ventral root. The arrow in C indicates the time of a single stimulus applied to L5 dorsal root (200 μs, 25 μA). The dots under the electrical traces indicate the timing of the frame shown on the right. Note in B that the spontaneous activity starts ventrally with the major activity ventromedial. D: graph summarizing the timing (in frames) of the fluorescent transients measured over 3 regions of interest shown in E. The 50% rise time of the optical signal is expressed with respect to the 50% signal rise time in the most ventral area. Data are averaged from 5 experiments and expressed as means ± SE.

Similar articles

Cited by

References

    1. Arai Y, Mentis GZ, Wu J and O'Donovan MJ. Ventro-lateral origin of activity during each cycle of spontaneous activity generated by the spinal cord of the chick embryo PLoS ONE 2: e417, 2007. - PMC - PubMed
    1. Beato M, Bracci E, Nistri A. Contribution of NMDA and non-NMDA glutamate receptors to locomotor pattern generation in the neonatal rat spinal cord. Proc Biol Sci. 264: 877–884, 1997. - PMC - PubMed
    1. Beato M, Nistri A. Interaction between disinhibited bursting and fictive locomotor patterns in the rat isolated spinal cord. J Neurophysiol. 82: 2029–2038, 1999. - PubMed
    1. Biscoe TJ, Nickels SM, Stirling CA. Numbers and sizes of nerve fibres in mouse spinal roots. Q J Exp Physiol 67: 473–494, 1982. - PubMed
    1. Bonnot A, Mentis GZ, Skoch J, O'Donovan MJ. Electroporation loading of calcium-sensitive dyes into the central nervous system J Neurophysiol 93: 1793–1808, 2005. - PubMed

Publication types

MeSH terms

LinkOut - more resources