. 2009 Apr 7;106(14):5831-6.
doi: 10.1073/pnas.0900912106. Epub 2009 Mar 25.

Gene deregulation and spatial genome reorganization near breakpoints prior to formation of translocations in anaplastic large cell lymphoma

Affiliations

Gene deregulation and spatial genome reorganization near breakpoints prior to formation of translocations in anaplastic large cell lymphoma

Stephan Mathas et al. Proc Natl Acad Sci U S A. .

Abstract

Although the identification and characterization of translocations have rapidly increased, little is known about the mechanisms of how translocations occur in vivo. We used anaplastic large cell lymphoma (ALCL) with and without the characteristic t(2;5)(p23;q35) translocation to study the mechanisms of formation of translocations and of ALCL transformation. We report deregulation of several genes located near the ALCL translocation breakpoint, regardless of whether the tumor contains the t(2;5). The affected genes include the oncogenic transcription factor Fra2 (located on 2p23), the HLH protein Id2 (2p25), and the oncogenic tyrosine kinase CSF1-receptor (5q33.1). Their up-regulation promotes cell survival and repression of T cell-specific gene expression programs that are characteristic for ALCL. The deregulated genes are in spatial proximity within the nuclear space of t(2;5)-negative ALCL cells, facilitating their translocation on induction of double-strand breaks. These data suggest that deregulation of breakpoint-proximal genes occurs before the formation of translocations, and that aberrant transcriptional activity of genomic regions is linked to their propensity to undergo chromosomal translocations. Also, our data demonstrate that deregulation of breakpoint-proximal genes has a key role in ALCL.


Conflict of interest statement

The authors declare no conflict of interest.

Figures

Fig. 1.
Fig. 1.
Up-regulation of breakpoint proximal genes in ALCL regardless of t(2;5). (A) Localization of the analyzed genes FRA2 (located on 2p23), ID2 (2p25), and CSF1R (5q33.1). In the case of t(2;5), the fusion of NPM (5q35) and ALK (2p23) results in the NPM-ALK fusion gene. Colored bars indicate positions of probes used for FISH in Fig. 4 A and C. (B) Analysis of FRA2, ID2, and CSF1R mRNA expression in various cell lines by Northern blot analysis (NB). Expression of GAPDH was analyzed as a control. (C) Immunohistochemistry of Fra2 and Id2 in ALCL carrying (Left) or lacking (Right) t(2;5). Cells with positive signals are stained in red. Large neoplastic cells show a strong nuclear staining for Fra2 and Id2, whereas no (Fra2) or only weak (Id2) signals are detectable in the small nonneoplastic cells. (Original magnification, 80×.)
Fig. 2.
Fig. 2.
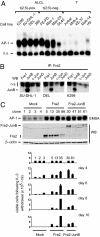
Characterization of the constitutively active AP-1 complex in ALCL cells. (A) EMSA of transcription factor AP-1 in nuclear extracts of various cell lines. n.s., nonspecific band, not the free probe. (B) CoIP of Fra2 and JunB. IP of Fra2 was performed in whole-cell extracts. Coprecipitated proteins were detected by Western blot analysis using antibodies specific for Fra1, JunB, c-Jun, and JunD. (C) Fra2 or Fra2-JunB protect Ba/F3 cells from IL-3 withdrawal. Representative stably transfected cell clones expressing FLAG-tagged Fra2 (clones 5, 13, 35, and 86) or a Fra2-JunB single-chain construct (clones 30, 47, 51, and 61), and respective Mock clones (clones 1, 2, 3, and 4) were analyzed by EMSA for AP-1 DNA binding activity (Upper), and for Fra2 and Fra2-JunB protein expression by Western Blot analysis using a Fra2-specific antibody; β-actin was analyzed as a control. (Lower) Representative Ba/F3 clones with different Fra2 or Fra2-JunB expression levels were starved from IL-3. Viable cells were counted at the days indicated. Error bars indicate SDs.
Fig. 3.
Fig. 3.
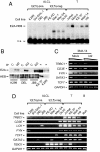
The Id2-mediated loss of T cell phenotype in ALCL. (A) Nuclear extracts of the various cell lines were analyzed by EMSA for E-box DNA binding activity. Positions of specific complexes (E2A-HEB) are indicated. n.s., nonspecific band, not the free probe. (B) CoIP of Id2-E2A and Id2-HEB complexes. Lysates of K299, DEL, and JB6 cells were immunoprecipitated with antibody to Id2 or the respective control (C). Coprecipitated E2A and HEB proteins were detected by WB. Far right (−), whole-cell extracts of KE-37 and K299 cells. (C) RT-PCR analysis of Molt-14 cells transfected with vector only (Mock) or Id2 expression plasmid along with pEGFP-N3. Input cDNA was diluted 1:1, 1:5, and 1:10 as indicated by triangles. T cell-associated genes were assessed by RT-PCR in enriched GFP+ cells. GAPDH was analyzed as a control. (D) Messenger RNA expression of T cell-associated genes by RT-PCR in various cell lines. T cell-derived cell lines (T) served as positive, B cell-derived Reh cells as a negative control. Genes LCK and FYN are expressed in B and T cells. GAPDH was analyzed as a control.
Fig. 4.
Fig. 4.
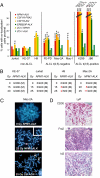
Analysis of spatial proximity of 5q and 2p. Induction of the translocation t(2;5) in cells with spatial proximity of 5q and 2p. (A) Two color FISH of the spatial proximity of indicated gene pairs was performed in various cell lines. The percentage of cells with at least 1 pair of heterologous loci in close spatial proximity (defined as <400 nm apart) is shown. *, statistical significance (ss) at P < 0.05 to both Jurkat and KE-37 control cell lines; **, ss at P < 0.05 to one of these cell lines; #, ss at P < 0.05 to both ZO-1-ALK/NPM1 control pairs; ##, ss at P < 0.05 to 1 ZO-1 control pair. (B) Induction of t(2;5) in cells with spatial proximity of 5q and 2p; 24 h after IR, metaphases were analyzed by 2-color FISH for NPM1 and ALK. Cells with t(2;5) were scored per 400 metaphases, where possible. (C) FISH analyses for NPM1 (green), ALK (red), or LSI ALK (green-red) as indicated. Representative metaphase spreads of Mac-2A cells are shown. Two signals for NPM1 and 3 for ALK were detectable in untreated cells (Top). One metaphase spread of irradiated cells hybridized with NPM1 and ALK with translocation t(2;5) is exemplified (Middle). Inset, chromosome with NPM1-ALK fusion signal. (Bottom) Metaphase spread of irradiated cells hybridized with the LSI ALK dual color, break-apart rearrangement probe, which proves breakage of the ALK locus. Gray arrows, 2 native ALK loci showing fused orange/green signals. White arrows, split red and green signal indicating breakage of the ALK locus. (D) IHC of a LyP case for CD30, Id2, and Fra2. IHC for CD30 (Top; included as a marker for LyP cells), Fra2 (Middle), and Id2 (Bottom) of 1 representative LyP case is shown (cells with positive signals stain red). Original magnification, 70×.

References

    1. Mitelman F, Johansson B, Mertens F. The impact of translocations and gene fusions on cancer causation. Nat Rev Cancer. 2007;7:233–245. - PubMed
    1. Janz S, Potter M, Rabkin CS. Lymphoma- and leukemia-associated chromosomal translocations in healthy individuals. Genes Chromosomes Cancer. 2003;36:211–223. - PubMed
    1. Chiarle R, Voena C, Ambrogio C, Piva R, Inghirami G. The anaplastic lymphoma kinase in the pathogenesis of cancer. Nat Rev Cancer. 2008;8:11–23. - PubMed
    1. Stein H, et al. CD30(+) anaplastic large cell lymphoma: A review of its histopathologic, genetic, and clinical features. Blood. 2000;96:3681–3695. - PubMed
    1. Mathas S, et al. Elevated NF-kappaB p50 complex formation and Bcl-3 expression in classical Hodgkin, anaplastic large-cell, and other peripheral T-cell lymphomas. Blood. 2005;106:4287–4293. - PubMed

Publication types

MeSH terms

Substances