. 2009 Apr 7;106(14):5657-62.
doi: 10.1073/pnas.0808355106. Epub 2009 Mar 25.

A mobile kinesin-head intermediate during the ATP-waiting state

Affiliations

A mobile kinesin-head intermediate during the ATP-waiting state

Ana B Asenjo et al. Proc Natl Acad Sci U S A. .

Abstract

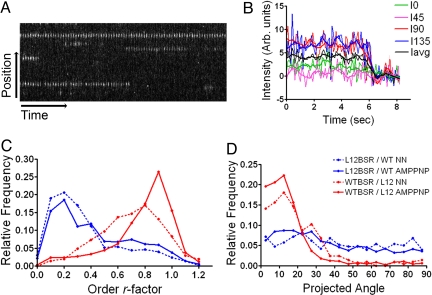
Kinesin1 is a motor protein that uses the energy from ATP hydrolysis to move intracellular cargoes along microtubules. It contains 2 identical motor domains, or heads, that coordinate their mechano-chemical cycles to move processively along microtubules. The molecular mechanism of coordination between head domains remains unclear, partly because of the lack of structural information on critical intermediates of the kinesin1 mechano-chemical cycle. A point of controversy has been whether before ATP binding, in the so called ATP-waiting state, 1 or 2 motor domains are bound to the microtubule. To address this issue, here we use ensemble and single molecule fluorescence polarization microscopy (FPM) to determine the mobility and orientation of the kinesin1 heads at different ATP concentrations and in heterodimeric constructs with microtubule binding impaired in 1 head. We found evidence for a mobile head during the ATP-waiting state. We incorporate our results into a model for kinesin translocation that accounts well for many reported experimental results.


Conflict of interest statement

The authors declare no conflict of interest.

Figures

Fig. 1.
Fig. 1.
Kinesin constructs and probe location. (A) Diagram of the 3 dimeric kinesin constructs used. The heterodimeric constructs wtBSR/L12 and L12BSR/wt have 1 BSR-labeled head (red arrow) and 1 head with the triple L12 mutation (L12). The homodimeric construct wtBSR/wt has no L12 mutation, and ≈87% of the labeled protein has only 1 BSR label (Methods). (B) Ribbon representation of the kinesin motor domain bound to the microtubule in a strong bound state according to cryo-em data (36). The CB atoms of residues 64 and 71 where the BSR probe is attached are indicated by the red spheres, and the resulting orientation of the attached fluorescent transition dipole is indicated by the red arrow. The direction of the long microtubule axis is indicated by the blue arrow. The location of the L12 residues mutated to affect microtubule binding are indicated in magenta.
Fig. 2.
Fig. 2.
Ensemble fluorescence polarization microscopy (FPM) bar plot of the calculated LD0 values. Error bars represent the SE of the estimated LD0 value. For details see Fig. S1.
Fig. 3.
Fig. 3.
Single molecule FPM of heterodimeric constructs. (A) Kymograph showing traces corresponding to single wtBSR/L12 constructs in the presence of AMP-PNP. (B) Intensity over time of a single molecule showing a single-step photobleaching event. Fluorescence polarizations corresponding to each of the 4 excitation polarization directions are shown in different colors. The average intensity is shown as black lines. Running average curves are superimposed on the raw data. (C) Frequency distribution of the average r-factor per molecule. (D) Frequency distribution of the average projected angle (PA) per molecule. Red and blue lines in C and D correspond respectively to the wtBSR/L12 and L12BSR/wt constructs. Continuous and pointed line patterns correspond respectively to the AMP-PNP and no-nucleotide conditions.
Fig. 4.
Fig. 4.
Single molecule FPM of wtBSR/wt molecules walking in the presence of ATP. (A) Kymograph showing traces of single kinesin molecules walking in the presence of 1 mM ATP. (B) Average speed vs. [ATP]. Error bars: SD. (C) Time averaged order r-factor frequency distributions of walking kinesin molecules at [ATP] of 1 nM (red) and 250 nM (blue). (D) Time averaged projected angle (PA) distributions (colors and [ATP] as in C). Frequency distribution in C and D were built by calculating the average r-factor and projected angle during the whole observation interval of each molecule (Methods). In C and D, for clarity only the 2 distributions corresponding to the extremes of the ATP concentrations investigated are plotted. (E) Order r-factor vs. [ATP]. (F) Projected angle vs. [ATP]. In E and F, the points represent the distributions mean and the error bars the 95% CI.
Fig. 5.
Fig. 5.
Transitions between low and high mobility states in walking kinesins. (A) Time traces of order r-factor (Top) and projected angle (Bottom) of a molecule moving processively at 32 nm/sec in the presence of 500 nM [ATP]. In the top figure, the black line corresponds to the measured r-factors and the red line to the idealized events detected using a hidden Markov algorithm (35). For clarity only a 5-sec segment of the whole trace (8.9 sec) is shown. 39 events (low and high r-factor) were detected in this trace. (B) Time-resolved order r-factor distribution of the molecule shown in A. Total number of intensity measurements in the distribution is 356. (C) Time-resolved projected angle distribution corresponding to the high (red lines) and low (blue lines) r-factor dwells. (D) Interpretation of the r-factor transients. As the kinesin molecule walks, the motor domains alternate between high and low mobile states so the probe attached to one of the heads (red line) reports alternating low and high r-factors. (E) Average r-factor <lifetime> vs. [ATP]. In each case the bars represent the average <lifetime> of 9 molecules and the error bars the SE. The total number of events (low and high r-factor) detected in the 9 molecules analyzed in each case were 131, 181, and 228, respectively, for the 250, 500, and 1000 nM [ATP] conditions.
Fig. 6.
Fig. 6.
Model for kinesin1 translocation. When a kinesin dimer containing 2 ADP molecule interacts with a microtubule for the first time, it releases 1 ADP molecule rapidly (14). The dimer then enters the ATP-waiting state with 1 mobile tethered head with ADP still bound to it. In this model, the nucleotide-free head is the leading one according to data indicating that nucleotide dissociation preferentially occurs in the forward-positioned head (29). Two possible configurations for the ATP-waiting state, consistent with our FPM data are shown. In the (Top) image, the tethered head is very mobile but remains weakly bound to the microtubule. In the (Bottom) image, the tethered head is detached from the microtubule. ATP binding to the microtubule-bound head docks its neck linker (–8), allowing the tethered mobile head to reach the next microtubule binding site. At saturating ATP, the ATP-waiting state would be short lived relative to the whole cycle, and the 2 heads would be tightly bound to the microtubule most of the time (20). A full 8-nm step is completed between the start and end of the ATP-waiting state. For further discussion, see also Discussion section.

References

    1. Endow SA. Kinesin motors as molecular machines. Bioessays. 2003;25:1212–1219. - PubMed
    1. Svoboda K, Schmidt CF, Schnapp BJ, Block SM. Direct observation of kinesin stepping by optical trapping interferometry. Nature. 1993;365:721–727. - PubMed
    1. Schnitzer MJ, Block SM. Kinesin hydrolyses one ATP per 8-nm step. Nature. 1997;388:386–390. - PubMed
    1. Hua W, Young EC, Fleming ML, Gelles J. Coupling of kinesin steps to ATP hydrolysis. Nature. 1997;388:390–393. - PubMed
    1. Coy DL, Wagenbach M, Howard J. Kinesin takes one 8-nm step for each ATP that it hydrolyzes. J Biol Chem. 1999;274:3667–3671. - PubMed

Publication types

LinkOut - more resources