. 2009 Mar 25;29(12):3865-74.
doi: 10.1523/JNEUROSCI.5639-08.2009.

Synaptic vesicle recycling at CNS snapses without AP-2

Affiliations

Synaptic vesicle recycling at CNS snapses without AP-2

Sung Hyun Kim et al. J Neurosci. .

Abstract

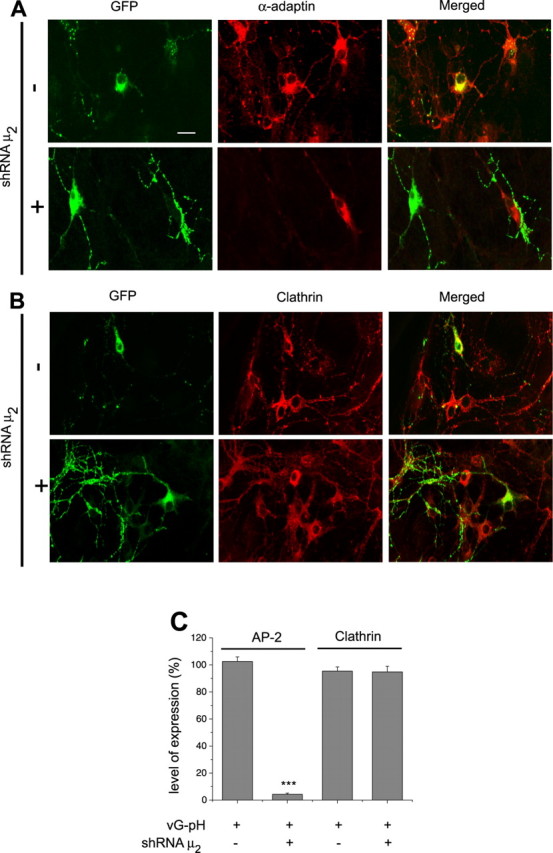
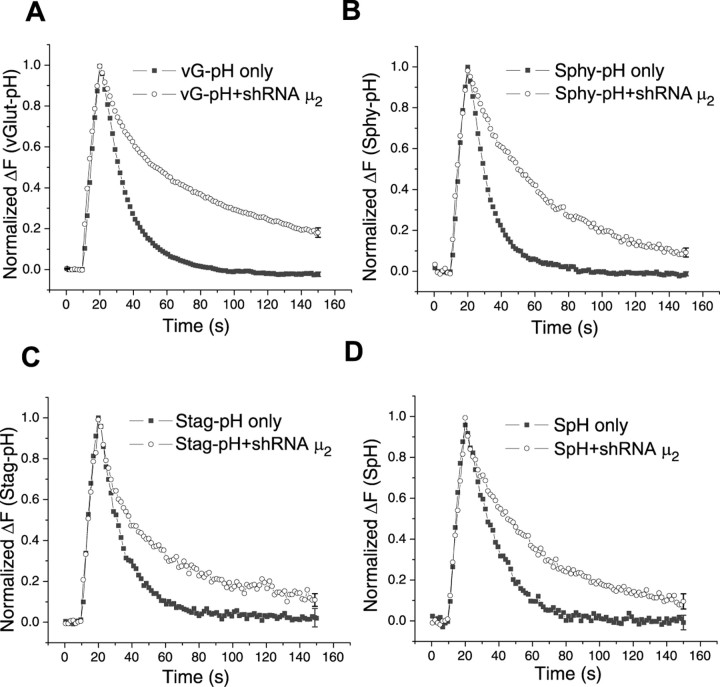
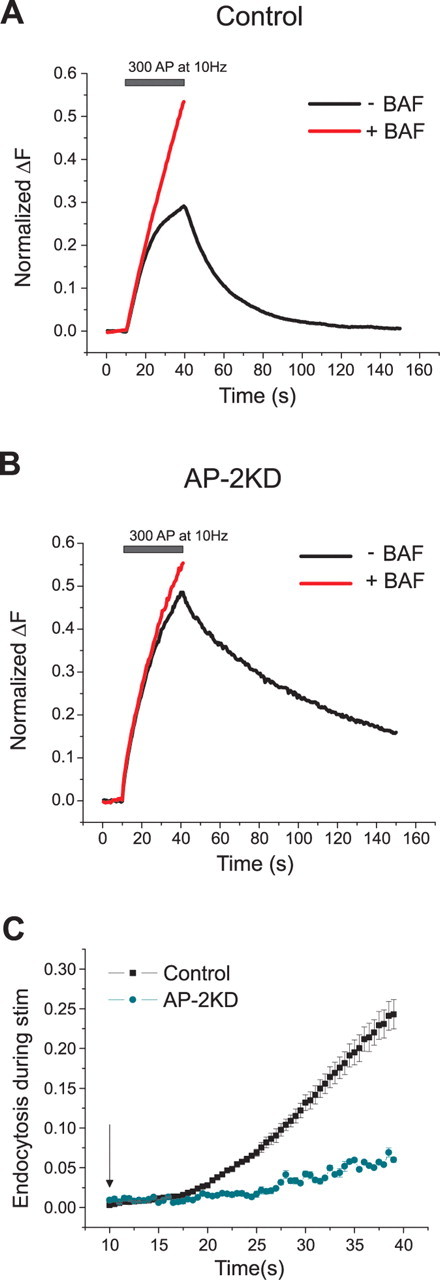
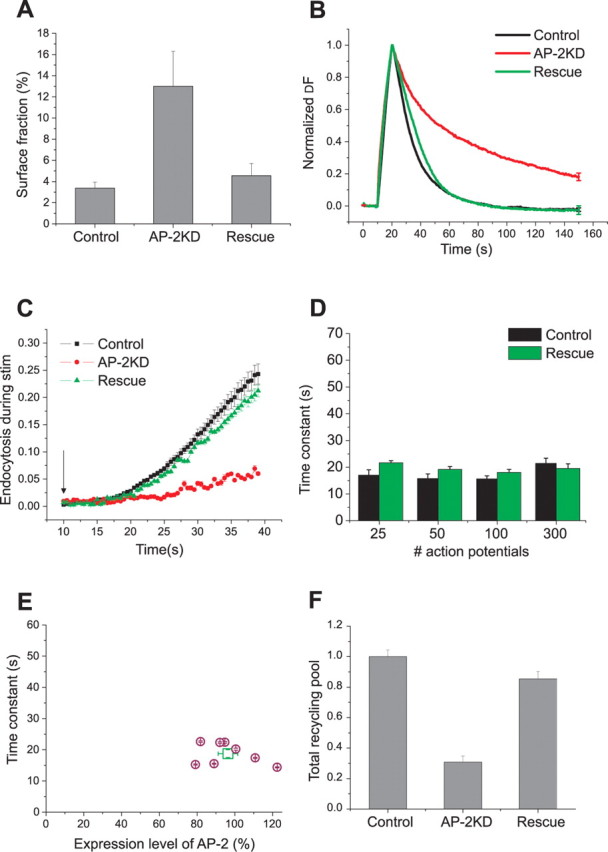
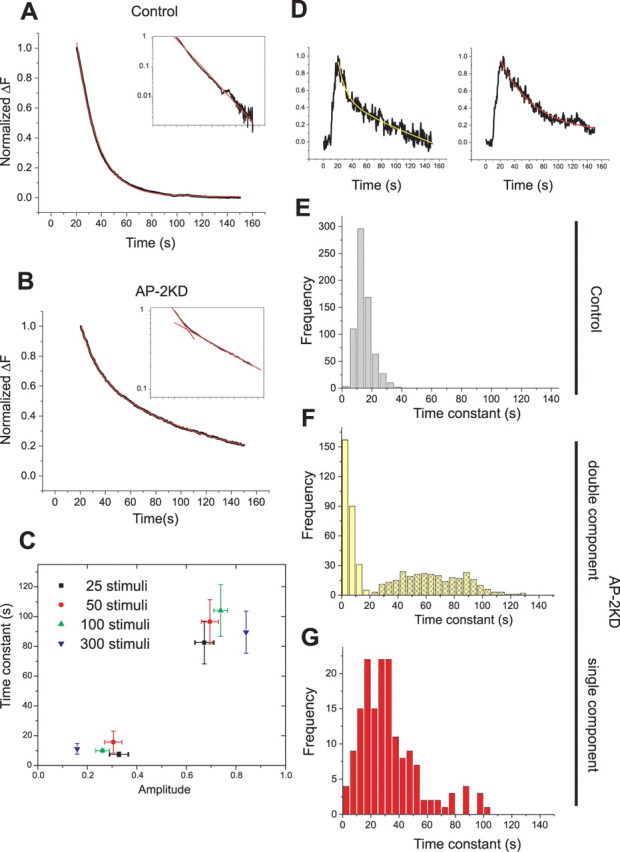
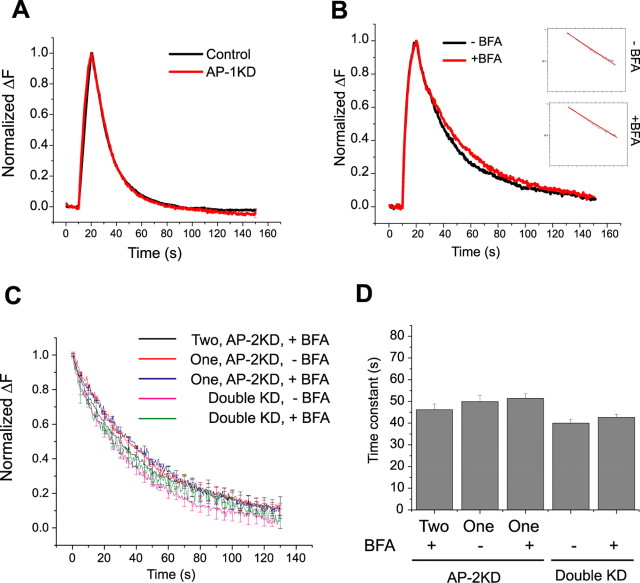
Synaptic vesicles (SVs) are composed of approximately 10 types of transmembrane proteins that must be recycled after exocytosis of neurotransmitter. The mechanisms for resorting these proteins into synaptic vesicles once incorporated into the plasma membrane after exocytosis are poorly understood. The adaptor complex AP-2 is the major clathrin-associated adaptor for cargo recognition at the plasma membrane. Here, we have investigated its role in synaptic vesicle endocytosis. shRNA-mediated knockdown of the AP-2 complex results in an approximately 96% reduction of this protein complex in primary neurons. We used simultaneous expression of shRNA and pHluorin-tagged vesicle components to show that the absence of AP-2 significantly slows but does not prevent the endocytosis of four of the major synaptic vesicle transmembrane proteins. We show that in the absence of AP-2, the AP-1 adaptor complex appears to functionally substitute for AP-2 but results in complex internalization kinetics that are now sensitive to the guanine-nucleotide exchange factor for ADP-ribosylation factor GTPase (ARF-GEF) inhibitor brefeldin-A (BFA). Simultaneous removal of both AP-2 and AP-1 prevents this compensatory substitution and results in slowed but functional endocytosis. These results demonstrate that in the absence of AP-2, SV proteins still become endocytosed, and synaptic vesicle recycling remains operational.


Figures

Figure 1.
Figure 1.
shRNA-targeting μ2 efficiently depletes AP-2 in hippocampal neurons. A, B, Primary hippocampal neurons transfected with vG–pH with/without shRNA-targeting μ2 were stained with both anti-GFP (green) and anti-α adaptin (red) (A) or anti-clathrin heavy chain (red; B) antibodies. Scale bar, 20 μm. C, In cells transfected with shRNA-targeting μ2, AP-2, but not clathrin, was severely depleted: [AP-2]AP-2KD = 4.3 ± 0.9% (n = 28) compared with controls (n = 20), whereas [AP-2] = 102.5 ± 3.4% in cells transfected with vG–pH alone compared with nontransfected cells. [Clathrin]AP-2KD = 94.8 ± 4.1% (n = 14) and [Clathrin] = 95.4 ± 3.1% (n = 17) in cells transfected with vG–pH alone compared with nontransfected cells. ***p < 0.01.
Figure 2.
Figure 2.
Depletion of AP-2 leads to increased surface fraction of vGlut–pHluorin and decreased recycling vesicle pool size. A, Surface expression of vG–pH was determined by measuring the fold change in fluorescence for boutons in normal saline for control and knockdown cells (AP-2KD) in response to application of NH4Cl. Scale bar, 10 μm. In control cells, the vG–pH surface expression at synaptic boutons was 3.38 ± 0.6% (n = 10), whereas in AP-2KD, the surface fraction was 13.0 ± 3.3% (n = 8). B, Schematic diagram of FM 4-64 staining and destaining experiment for measurement of total recycling pool. Cells were stimulated in the presence of FM 4-64 to turn over the entire recycling pool at 20 Hz for 100 s and further incubated for an additional 5 min after end of the stimulation. After washing for 3 min with Advasep buffer and additional 10 min with Ca2+-free Tyrodes, neurons were stimulated twice (10 Hz for 150 s and 10 Hz 60 s) in normal Tyrodes and the total dye released was measured to determine the size of the recycling pool. The recycling pool was 30.0 ± 3.6% (n = 10) in the AP-2KD compared with controls (n = 10).
Figure 3.
Figure 3.
Poststimulus endocytosis of four major synaptic vesicle proteins slowed in the absence of AP-2. A, Representative ensemble average traces of endocytosis from various SV constructs. Cells were transfected with pHlourin-tagged synaptic vesicle proteins, vG–pH, synaptophysin (Sphy–pH), synaptotagmin (Stag–pH), VAMP-2 (SpH) with/without shRNA-targeting μ2. Neurons were stimulated at 10 Hz (100 action potentials). B, The time to decay to 1/e of the peak value was significantly greater for each construct in the AP-2KD compared with control (SpH only, n = 4; SpH with shRNA μ2, n = 7; vG–pH only, n = 13; vG–pH with shRNA μ2, n = 18; Stag-pH only, n = 4; Stag-pH with shRNA μ2, n = 4; Sphy-pH only, n = 5; Sphy-pH with shRNA μ2, n = 16).
Figure 4.
Figure 4.
Endocytosis during stimulation is severely decreased in the absence of AP-2. A, B, Representative ensemble average vG–pH traces from control (A) and AP-2KD (B) neurons stimulated in the presence (red) or absence (black) of bafilomycin (Baf) with 300 action potentials (10 Hz) normalized to the maximum fluorescence value obtained with 900 action potential stimulation in Baf (the total recycling pool). C, Endocytosis during stimulation in control neurons corresponds to 24.3 ± 1.8% (n = 6), whereas in AP-2KD neurons, it was 5.9 ± 0.3% (n = 8), respectively, of the recycling pool. Stimulation start marked by arrow. Endocytosis during activity was calculated as (ΔFBaf − ΔF300 non baf) and normalized to the maximal plateau value achieved during stimulation in Baf.
Figure 5.
Figure 5.
Expression of shRNA-resistant μ2 rescues endocytic phenotype in AP-2KD neurons. A, Expression of shRNA-resistant μ2 in AP-2KD cells restores the surface fraction to control levels. Surface fraction was determined as in Figure 2 (A, B) by application of NH4Cl, pH 7.4, giving a value 4.6 ± 1.2%. n = 7 in the rescued cells, similar to controls (3.38 ± 0.6%, n = 10). B, Representative ensemble average examples from control (black), AP-2KD (red), and rescue (green) neuron responses to 100 action potential stimulation. For rescue of AP-2KD, neurons were transfected with shRNA-targeting μ2, shRNA resistant μ2, and vG–pH; n = 8. C, shRNA-resistant μ2 expression in AP-2KD neurons rescued endocytosis during stimulation. Endocytosis during stimulation (300 action potentials at 10 Hz, start of stimulus marked by arrow) was determined as in Figure 4 as (ΔFBaf − ΔF300 no baf) and showed that the total amount of endocytosis was 21.2 ± 1.1% (n = 7) similar to controls (Fig. 4C). D, Poststimulus endocytosis is restored by expression of shRNA-resistant μ2 in the AP-2KD for various stimulation conditions (25, 50, 100, and 300 action potential stimuli at 10 Hz, respectively; n = 8). E, Comparison of endocytosis time constant with the degree of AP-2 expression obtained in rescue experiments. After live-cell imaging, neurons were fixed and labeled with anti-α-adaptin antibody and expression quantified as in Figure 1. The average value is shown (square symbol) in addition to the individual values for each neuron (n = 8). F, Recovery of the defect in recycling pool was achieved by expression of shRNA-resistant μ2 in the AP-2KD neurons. Recycling pool size was measured as in Figure 2 (C, D). The recycling pool size compared with neurons transfected with vG–pH alone was 85.4 ± 4.9% (n = 6).
Figure 6.
Figure 6.
In the absence of AP-2, endocytosis has complex internalization kinetics. A, B, Representative average traces of endocytosis from control (A) and AP-2KD (B) neurons after stimulation. Ensemble average vG–pH fluorescence traces from individual neurons were fit with a single exponential decay (red) in the control neuron (A) or double exponential decay (red) in the AP-2KD neuron (B). Traces displayed as semilog plot (inset) to illustrate the appearance of a second component. C, In AP-2KD neurons, the weighting amplitudes (amp) and values of the two time constants were determined for various stimulation conditions (n = 7–8 cells for each condition): τ25AP fast = 7.5 ± 1.5 s, amp25AP fast = 32.8 ± 3.9%; τ25AP slow = 82.6 ± 14.4 s, amp25AP slow = 67.2 ± 3.9%; τ50AP fast = 15.7 ± 7.4 s, amp50AP fast = 30.5 ± 3.6%; τ50AP slow = 96.5 ± 14.9 s, amp50AP slow = 69.5 ± 3.6%; τ100AP fast = 10.0 ± 1.0 s, amp100AP fast = 26.2 ± 3.5%; τ100AP slow = 104.1 ± 17.4 s, amp100AP slow = 73.8 ± 3.5%; τ300AP fast = 11.2 ± 3.6 s, amp300AP fast = 15.9 ± 2.8%; τ300AP slow = 89.6 ± 14.1 s, amp300AP slow = 84.1 ± 2.8%, respectively). D, Individual boutons from the same AP2-KD neuron show different internalization kinetics. The vG–pH trace of an individual bouton on the left shows a double-exponential decay, whereas the trace from an individual bouton on the right is adequately fit with a single exponential decay. Analysis over several hundred boutons from many cells shows that 36% of boutons were adequately fit by single exponential decays. E–G, The distribution of time constants of single bouton analysis from control (E, n = 680) and AP-2KD (F, double exponential, n = 273; G, single exponential, n = 154) neurons.
Figure 7.
Figure 7.
Endocytosis is brefeldin-A-sensitive in the majority of synapses in the absence of AP-2. A–C, Endocytosis in control neurons is insensitive to BFA. vG–pH fluorescence recovery of neurons transfected with vG–pH and stimulated with 100 action potentials at 10 Hz before (black) and after (red) 30 min treatment of BFA (10 μg/ml). B, C, Semilog plots of the same traces before (B) and after (C) BFA treatment are shown. D–F, Endocytosis in AP-2KD neurons is sensitive to brefeldin-A. vG–pH fluorescence recovery of neurons transfected with vG–pH and shRNA-targeting μ2 and stimulated with 100 action potentials at 10 Hz before (black) and after (red) 30 min treatment of BFA (10 μg/ml). Semilog plots of the same traces before (E) and after (F) BFA treatment are shown. After BFA treatment, only a single component persists in the AP-2KD neurons. Time constant in control cells (A–C) is not significantly different after BFA treatment (Con; τBefore = 12.4 ± 0.9 s, τAfter = 12.9 ± 1.5 s; n = 3). In AP-2KD (D–F), only a single intermediate valued time constant is required to fit the endocytic recovery after BFA treatment (AP-2KD; τ-BFA fast = 11.2 ± 1.9 s, τ-BFA slow = 84.8 ± 6.7 s, τ+BFA = 45.1 ± 6.7 s; n = 7). G, H, The distribution of time constants obtained from single boutons in AP-2KD neurons before (G) and after (H) BFA treatment.
Figure 8.
Figure 8.
Brefeldin-A sensitivity and complex kinetics in the absence of AP-2 arise from compensation by AP-1. A, Representative ensemble average of endocytosis from control (black) and AP-1KD (red) neurons. Neurons were stimulated at 10 Hz (100 action potentials). The average time constant for vG–pH fluorescence decay in control (τcontrol = 15.6 ± 1.2 s) and AP-1KD neurons (τAP-1KD = 16.4 ± 1.3 s; n = 7) are not significantly different. B, Representative vG–pH trace of endocytosis in the presence or in the absence of BFA in double (AP-1/AP-2) KD neurons. Semilog plot of poststimulus endocytosis are shown in the inset (inset: top, −BFA; bottom, +BFA). Time constant of endocytosis obtained from individual cell ensemble average in the presence or in the absence of BFA (n = 5) in double KD neurons has minor sensitivity to BFA (τBefore = 38.2 ± 4.3 s; τAfter = 43.9 ± 5.1 s). C, D, Representative ensemble average vG–pH fluorescence recovery traces (C) and average time constant (D) of endocytosis from single bouton analysis from BFA treated or untreated AP-2KD and double (AP-1/AP-2) KD neurons. The data for AP-2KD were sorted into the average value of the time constant in BFA for boutons that showed either two (Two) or a single (One) exponential component before BFA application. This analysis shows that these conditions all have similar average endocytosis kinetics (AP-2KD; τtwo BFA+ = 46.2 ± 2.5 s, τone BFA− = 49.9 ± 2.8 s, τone BFA+ = 51.4 ± 2.2 s: Double KD; τBFA− = 40.0 ± 1.7 s, τ BFA+ = 42.7 ± 1.5 s.). For each category, the average was derived from between 108 and 131 boutons from four to seven different cells.

References

    1. Atluri PP, Ryan TA. The kinetics of synaptic vesicle reacidification at hippocampal nerve terminals. J Neurosci. 2006;26:2313–2320. - PMC - PubMed
    1. Augustine GJ, Morgan JR, Villalba-Galea CA, Jin S, Prasad K, Lafer EM. Clathrin and synaptic vesicle endocytosis: studies at the squid giant synapse. Biochem Soc Trans. 2006;34:68–72. - PMC - PubMed
    1. Balaji J, Ryan TA. Single-vesicle imaging reveals that synaptic vesicle exocytosis and endocytosis are coupled by a single stochastic mode. Proc Natl Acad Sci U S A. 2007;104:20576–20581. - PMC - PubMed
    1. Balaji J, Armbruster M, Ryan TA. Calcium control of endocytic capacity at a CNS synapse. J Neurosci. 2008;28:6742–6749. - PMC - PubMed
    1. Blumstein J, Faundez V, Nakatsu F, Saito T, Ohno H, Kelly RB. The neuronal form of adaptor protein-3 is required for synaptic vesicle formation from endosomes. J Neurosci. 2001;21:8034–8042. - PMC - PubMed

Publication types

MeSH terms

Substances